Figure 6. Quantification and validation of single-cell alternative splicing. A–C: Sashimi plots created in Integrated Genomics Viewer (IGV) display previously annotated alternative splicing events in the
ADD1 (A), ADD3 (B), and ECT2 (C) microvascular barrier genes within four exemplar individual cells. D: The alternative splicing detected in the SNAP23 gene is a novel event not previously reported. Percent spliced in values (PSI ψ) for each event range from 0, indicating
that an exon is always spliced out in this cell, to 1, indicating that all reads within this cell include this exon; values
in between represent a mix of isoforms within this cell. The splicing events shown are supported by more than ten reads in
each cell. The position of primers used for RT–PCR validation are indicated with arrows, and the length of the predicted amplification
products in nucleotides is indicated to the right of each plot. E: The detected splicing events were validated using RT–PCR with primers flanking the exon of interest. For all genes, the
two predicted products were amplified, differing by the length of the alternatively spliced exon. F: Heatmap of PSI values for each alternative splicing event identified in the barrier model genes and detected in more than
ten cells.
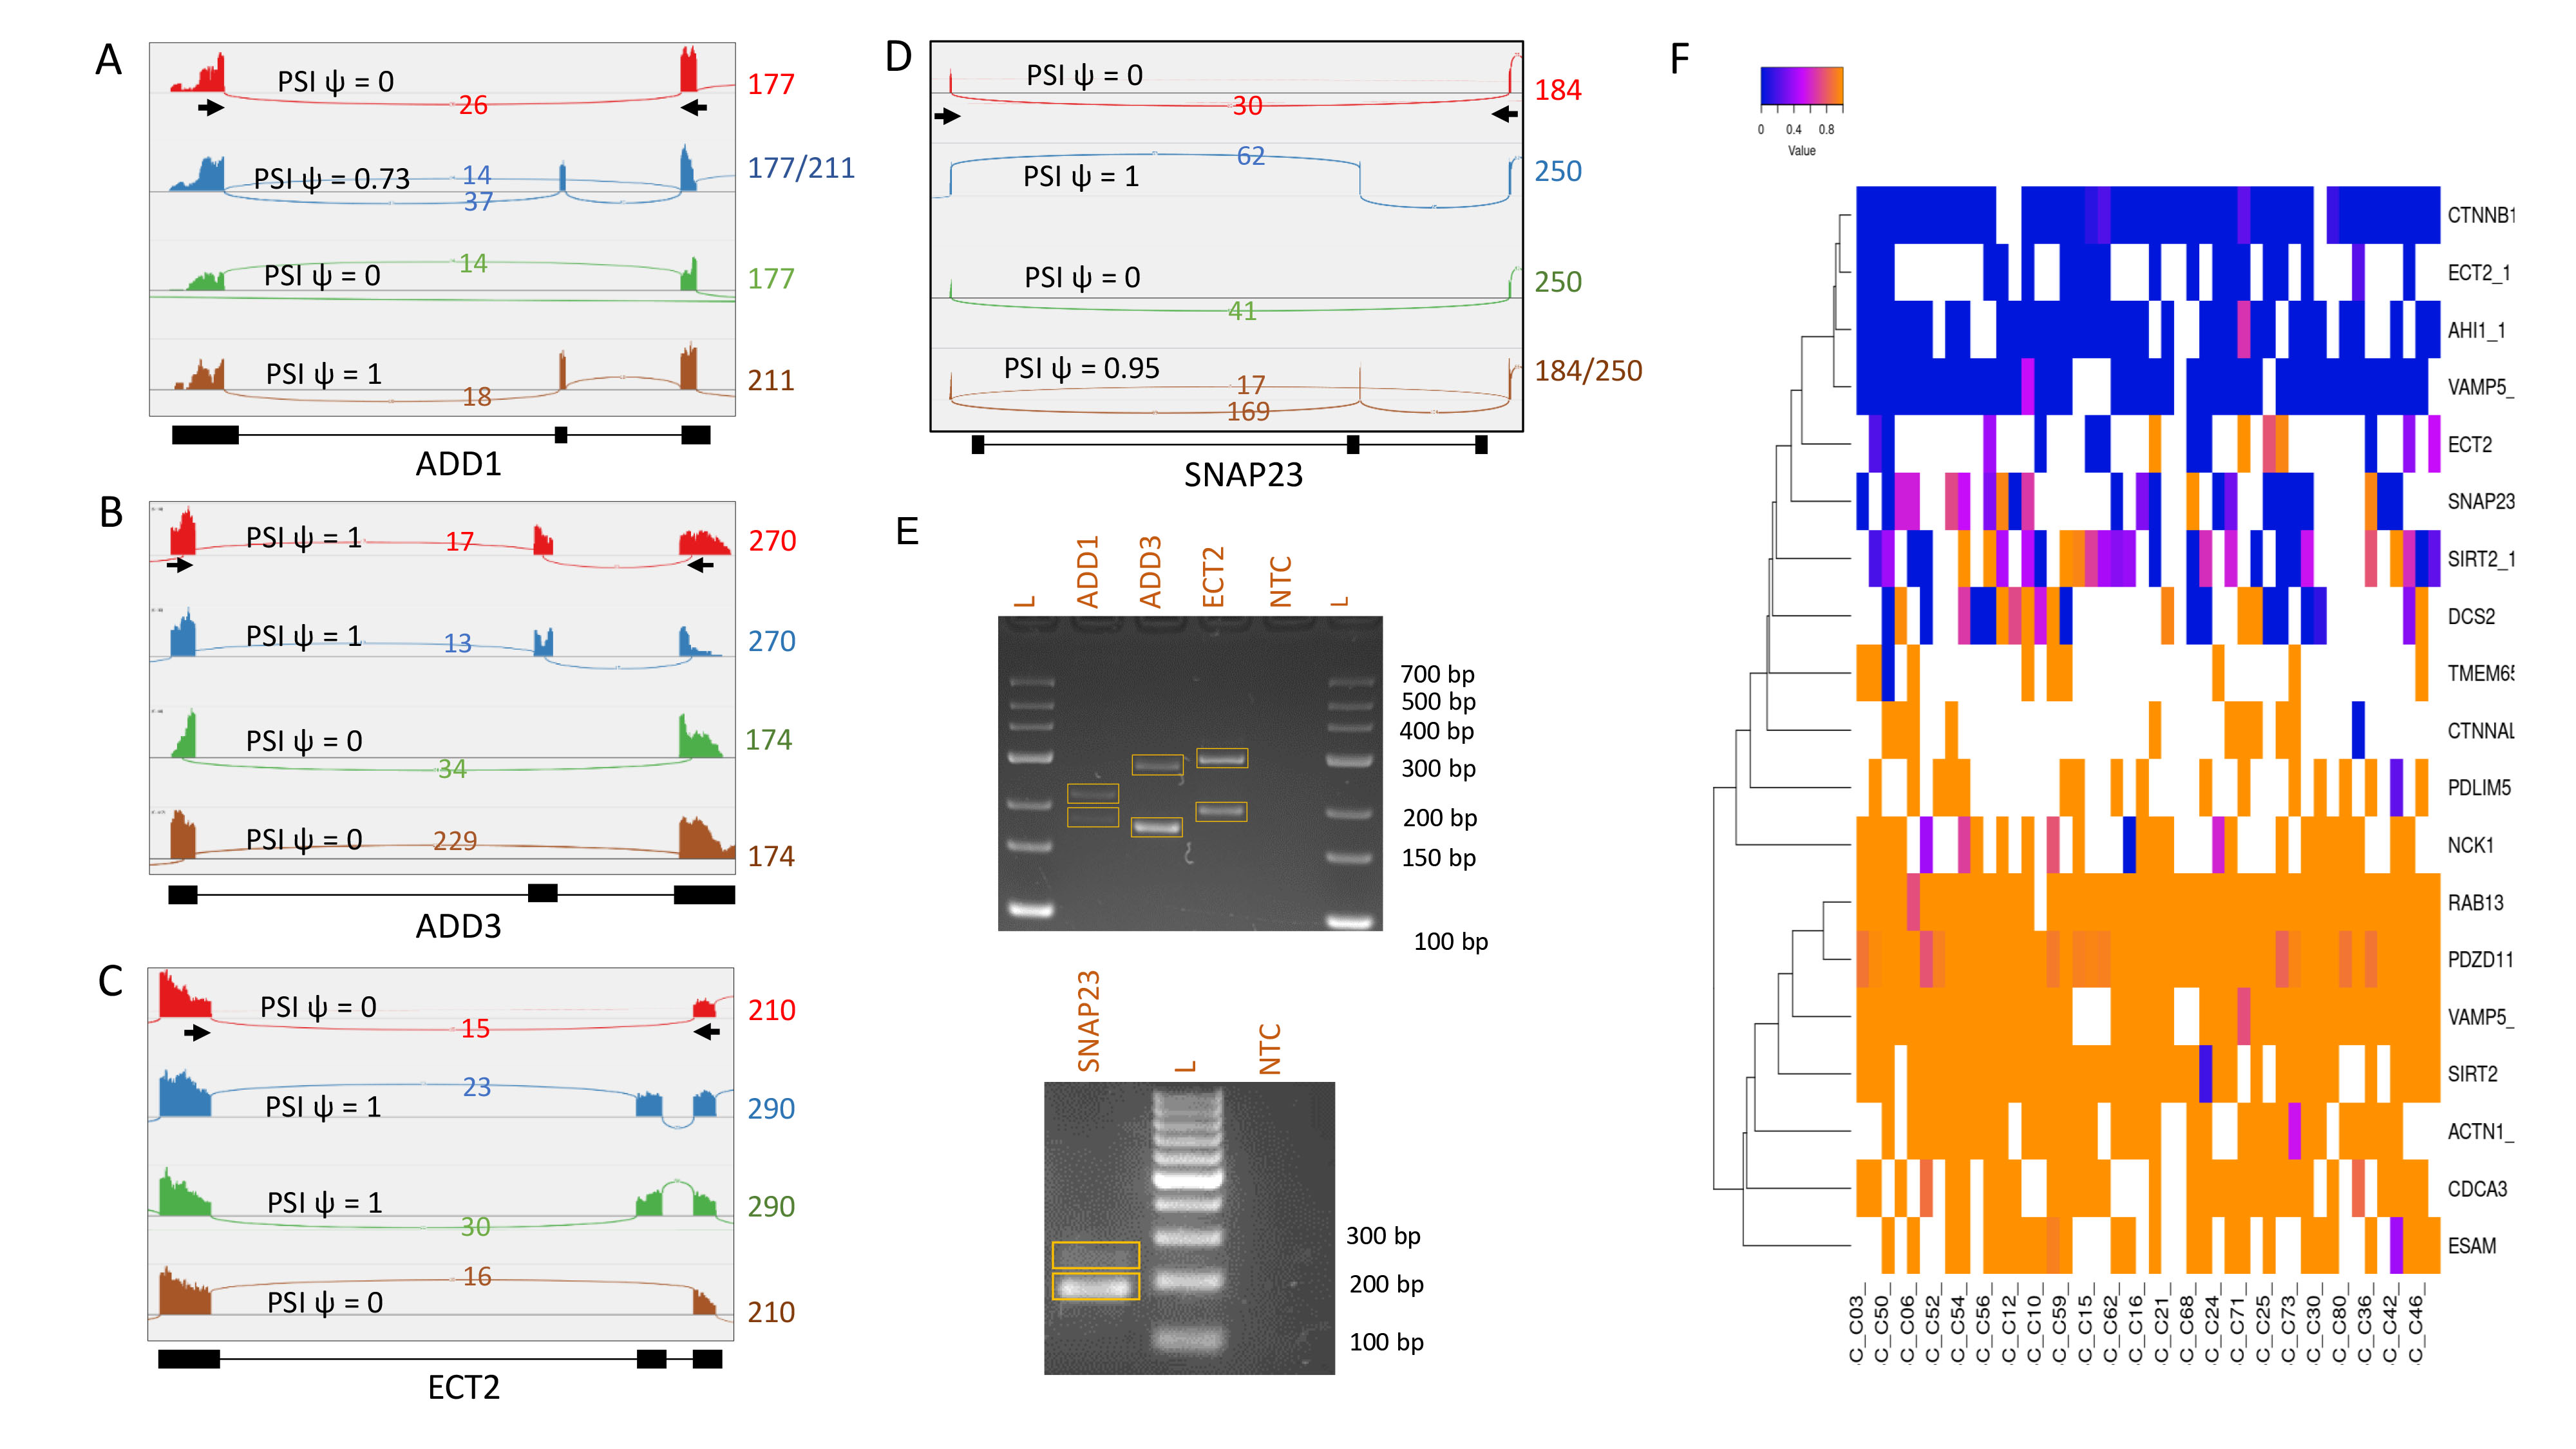
 Figure 6 of
Watson, Mol Vis 2020; 26:766-779.
Figure 6 of
Watson, Mol Vis 2020; 26:766-779.