Figure 4. Differential expression of barrier genes between individual cells. A: Violin plots show the expression of selected barrier genes in single cells, with the size of the marker indicating total
counts in that cell and the color indicating whether it is a proliferating or non-proliferating cell. Some barrier genes are
highly expressed in all cells, others low or undetectable in some cells and higher in others (suggestive of bimodal expression),
and others low in most cells. B: A heatmap of the correlation between the expression of all barrier genes across all individual cells reveals a subset of
highly correlated genes that are shown in more detail in the right heatmap of genes with Pearson correlation >0.5. Correlation
does not imply that the genes are involved in the same function, but known protein–protein interactions can be used to investigate
this possibility. Visualization of interactions as networks, with the thickness of the edges reflecting the weight of the
correlation, highlights the position of PECAM-1 at the core of a small group of highly correlated genes.
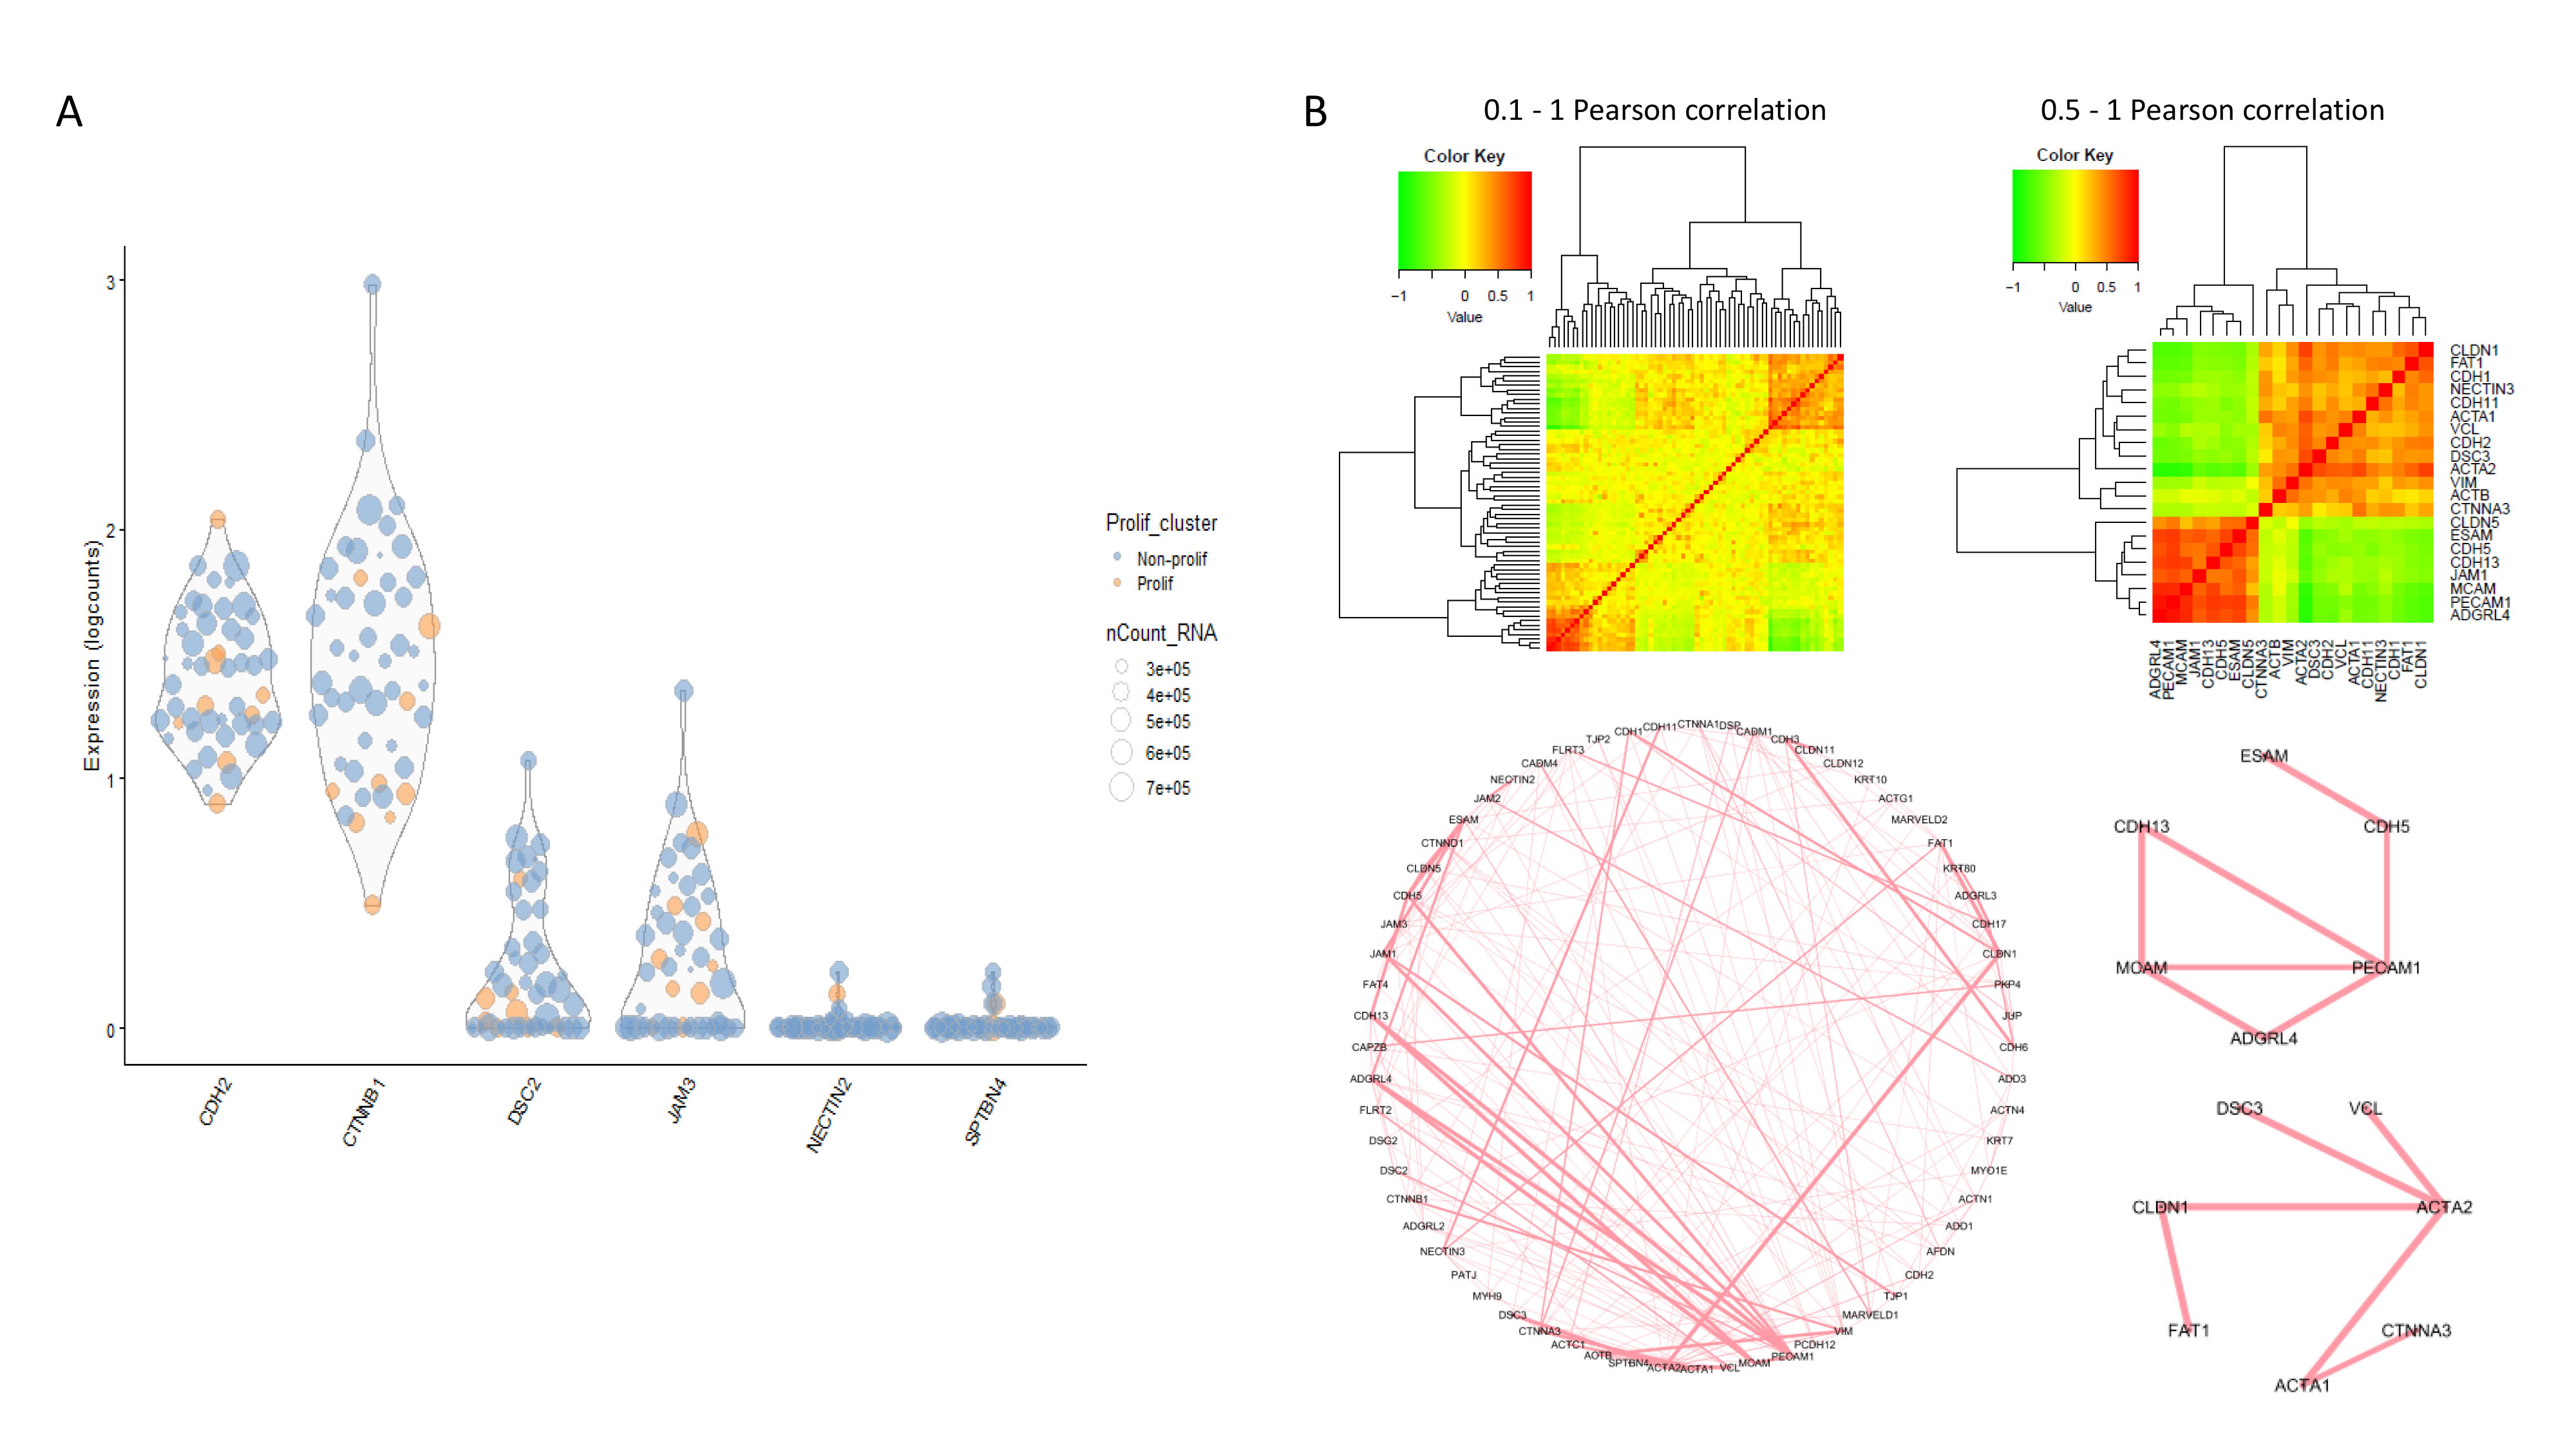
 Figure 4 of
Watson, Mol Vis 2020; 26:766-779.
Figure 4 of
Watson, Mol Vis 2020; 26:766-779.