Figure 1. UMAP visualization of the RMEC population according to the individual cell transcriptomes. There are no distinct clusters
that would indicate the presence of subpopulations of retinal microvascular endothelial cells (RMECs; following batch correction
and regression of cell cycle effects). The scattered distribution of cells with different genotypes suggests that the variability
between cells from the same individual is similar to that between cells from different individuals. The random distribution
of cells from each batch (shape) and with differing total counts (size) demonstrates that these potential technical effects
do not have a significant influence.
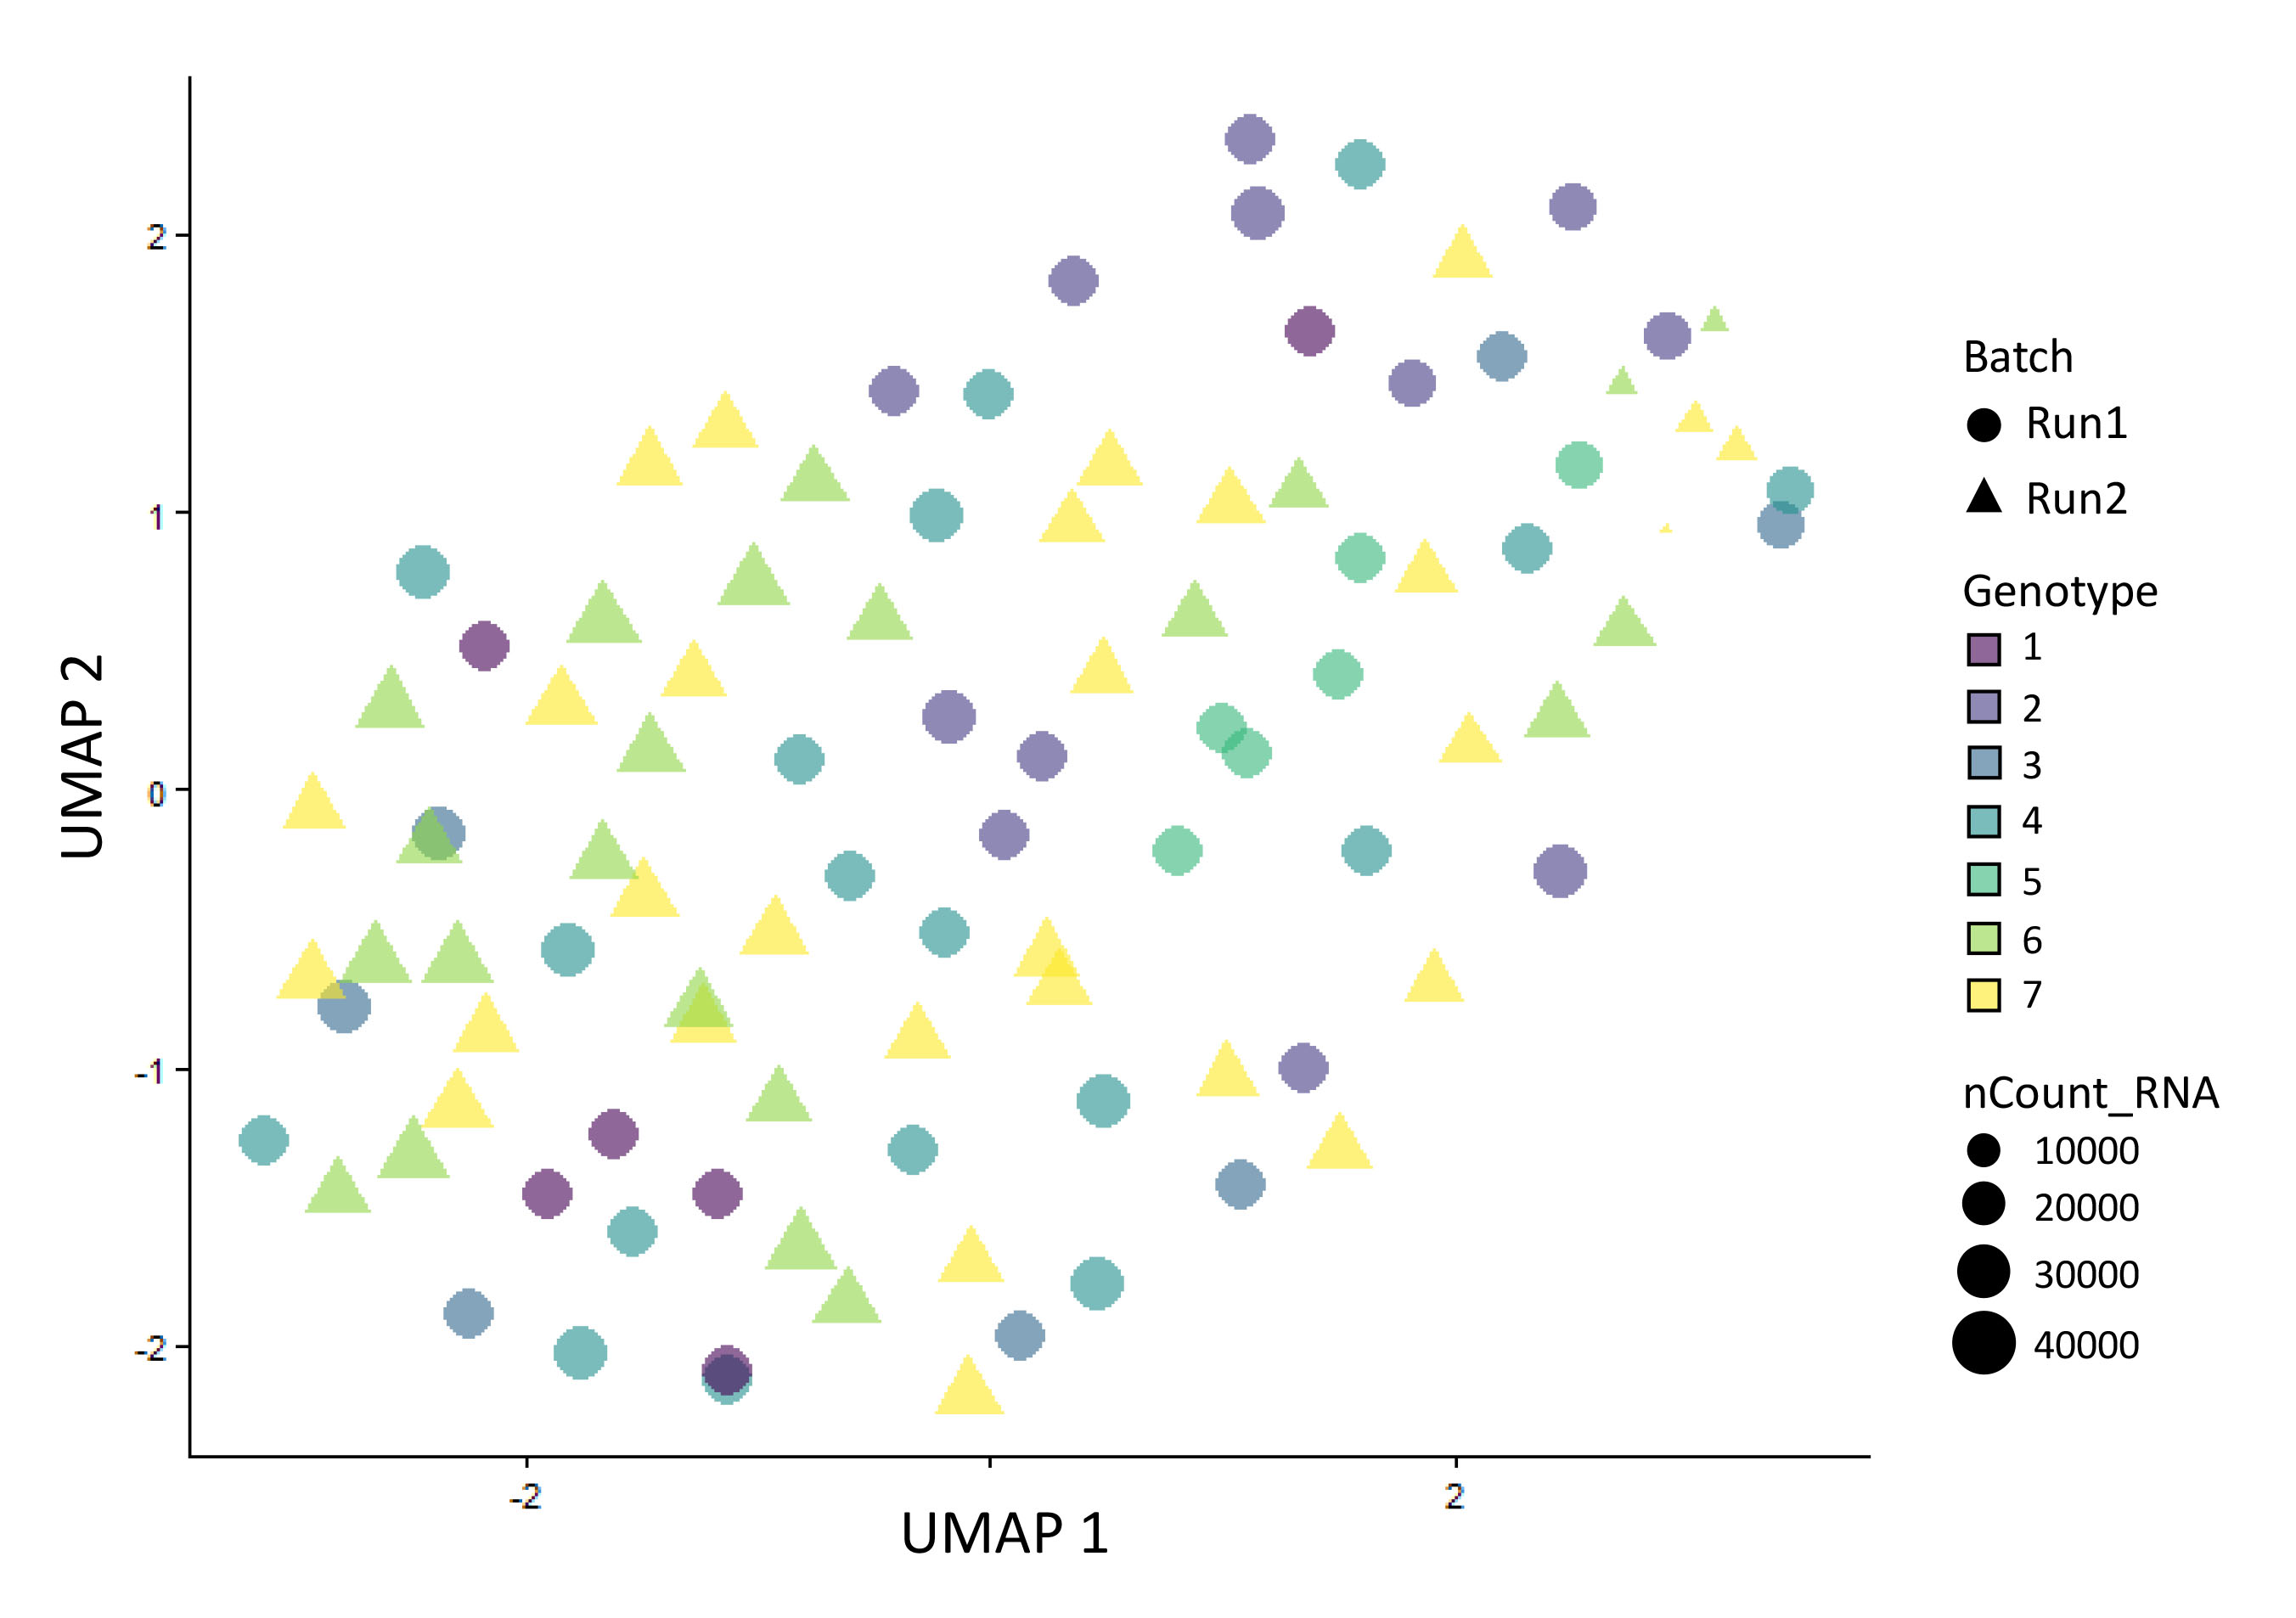
 Figure 1 of
Watson, Mol Vis 2020; 26:766-779.
Figure 1 of
Watson, Mol Vis 2020; 26:766-779.