Figure 3. Protein abundance ratio distribution. Differentially expressed proteins (p<0.05, fold change>1.2 or <0.83, n=3, Student t test) are plotted in this scattergram. A total of 148 upregulated proteins and 222 downregulated proteins were observed.
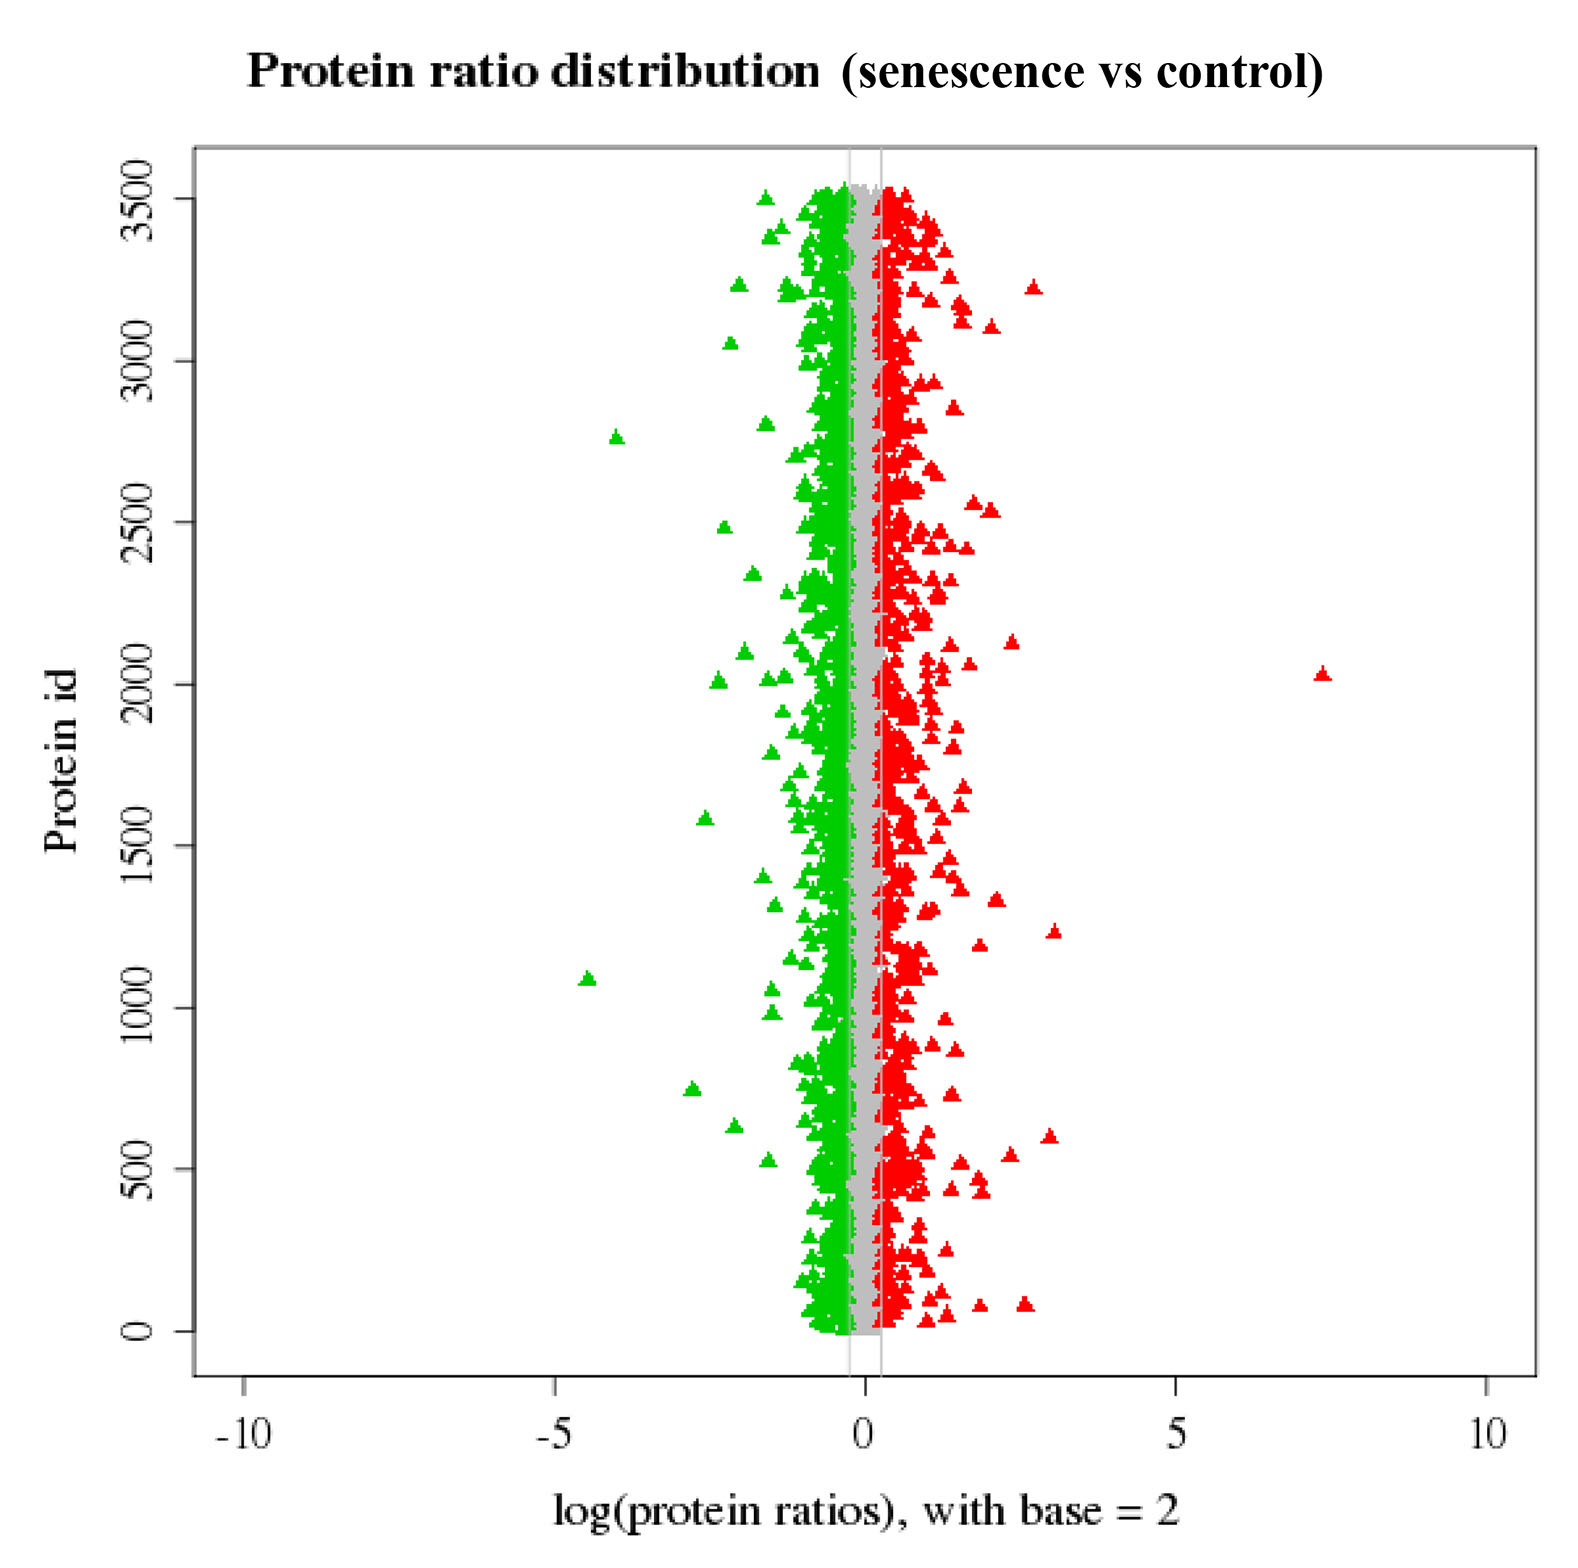
 Figure 3 of
Tan, Mol Vis 2020; 26:76-90.
Figure 3 of
Tan, Mol Vis 2020; 26:76-90.