Figure 3 of
Darbari, Mol Vis 2020; 26:757-765.
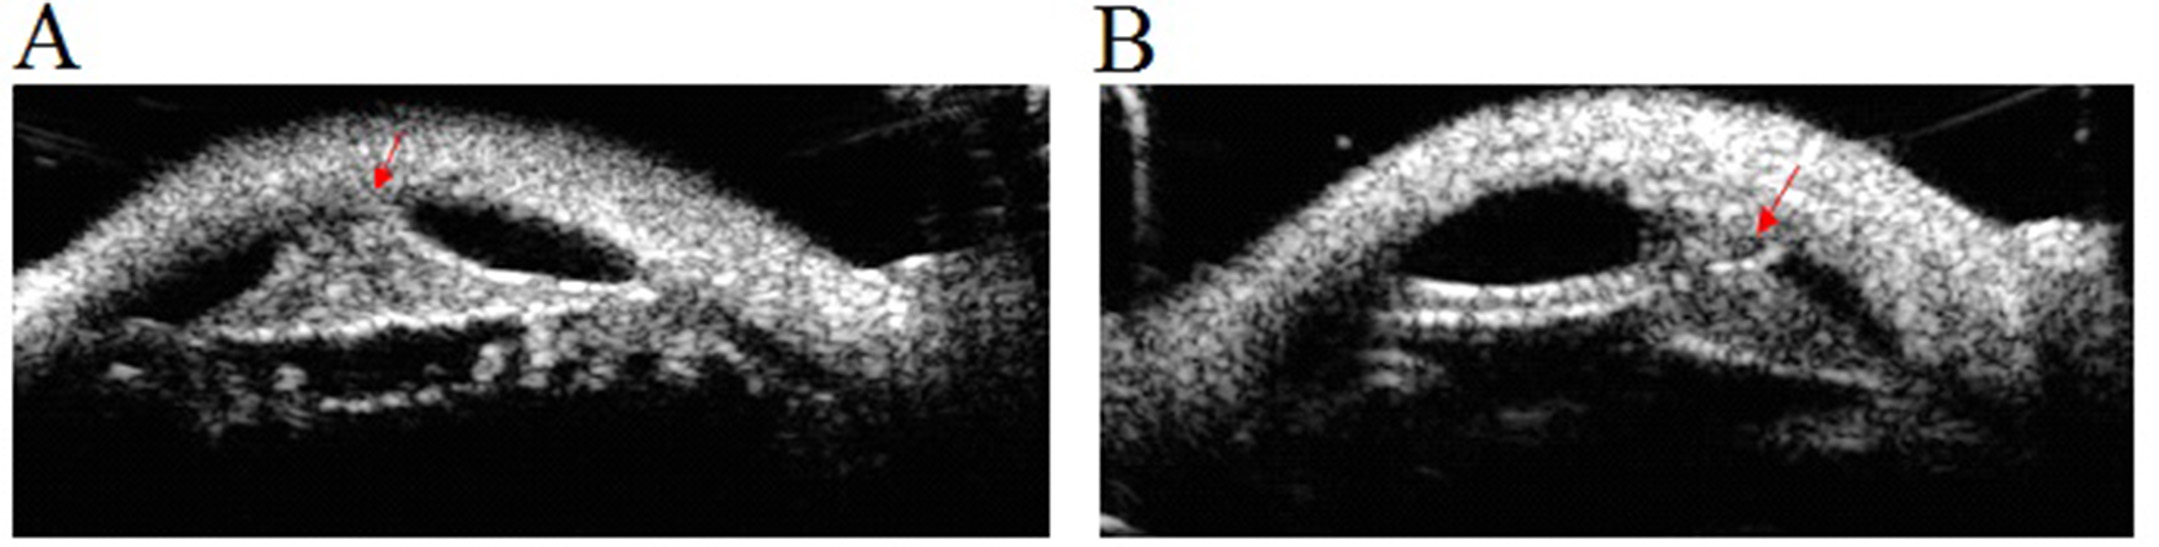
Figure 3.
Ultrasound biomicroscopy images show the Peters anomaly.
A
: PA-101-VI4.
B
: PA-101-VI5. Images of both patients show iridocorneal adhesion (arrows).
 Figure 3 of
Darbari, Mol Vis 2020; 26:757-765.
Figure 3 of
Darbari, Mol Vis 2020; 26:757-765.