Figure 2. Slit-lamp biomicroscopy images show the Peters anomaly. A: PA-101-VI4. B: PA-101-VI5. C: PA-101-VII2. The images of PA-101-VI4 and PA-101-VI5 show total corneal opacity and vascularization. The image of PA-101-VII2
shows total corneal opacity and superficial keratinization.
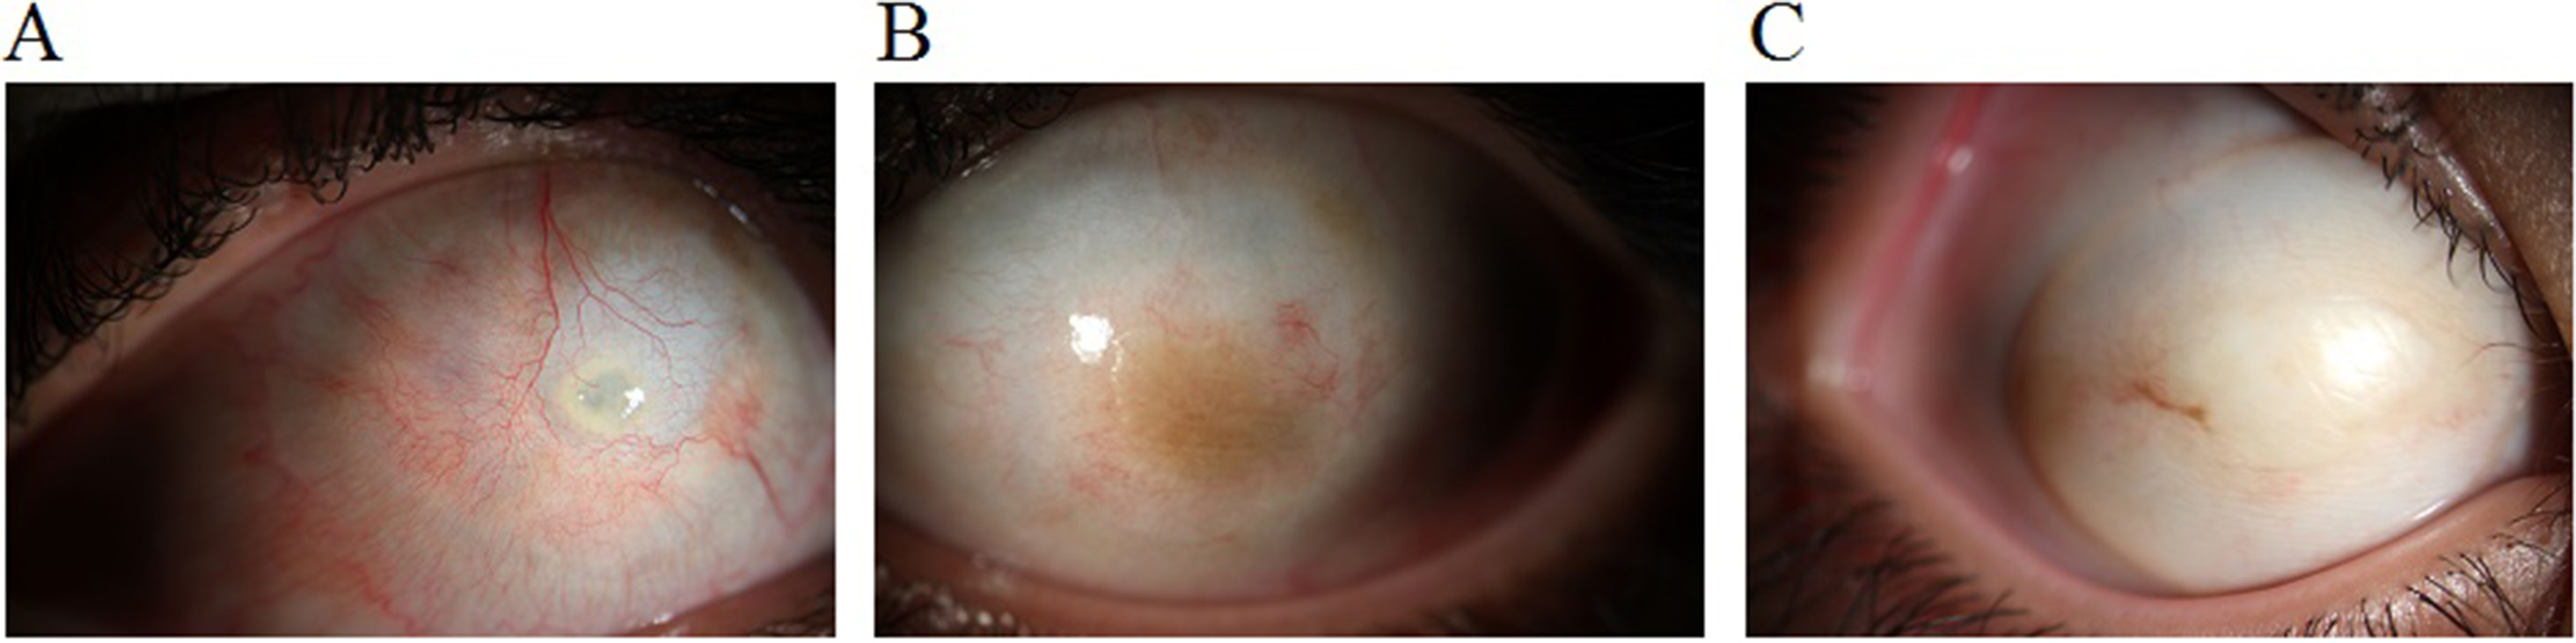
 Figure 2 of
Darbari, Mol Vis 2020; 26:757-765.
Figure 2 of
Darbari, Mol Vis 2020; 26:757-765.