Figure 4. Gene number per cell, detected with scRNA-seq using different sample preparation methods. A, B, D–F: Violin plots of genes detected per cell for each retinal cell type using fresh tissue dissociated with the frequently used
protocol (A) and the optimized protocol (B, D), methanol fixed cells (E), and single nuclei suspensions (F). C: Euler diagrams showing the number of genes detected in the majority of the cells (≥50% of a particular cell type). White
circles refer to data generated by the frequently used protocol (A). Colored circles refer to data generated using the optimized protocol (B). Colors are cell type matched. G: Table showing the total number of cells, proportion per cell type, and number of replicates. v2 corresponds to the use of
Chromium Single Cell system chemistry Single Cell 3′ Library and Gel Bead Kit v2, whereas v3.1 indicates Single Cell 3ʹ GEM,
Library and Gel Bead Kit v3.1.
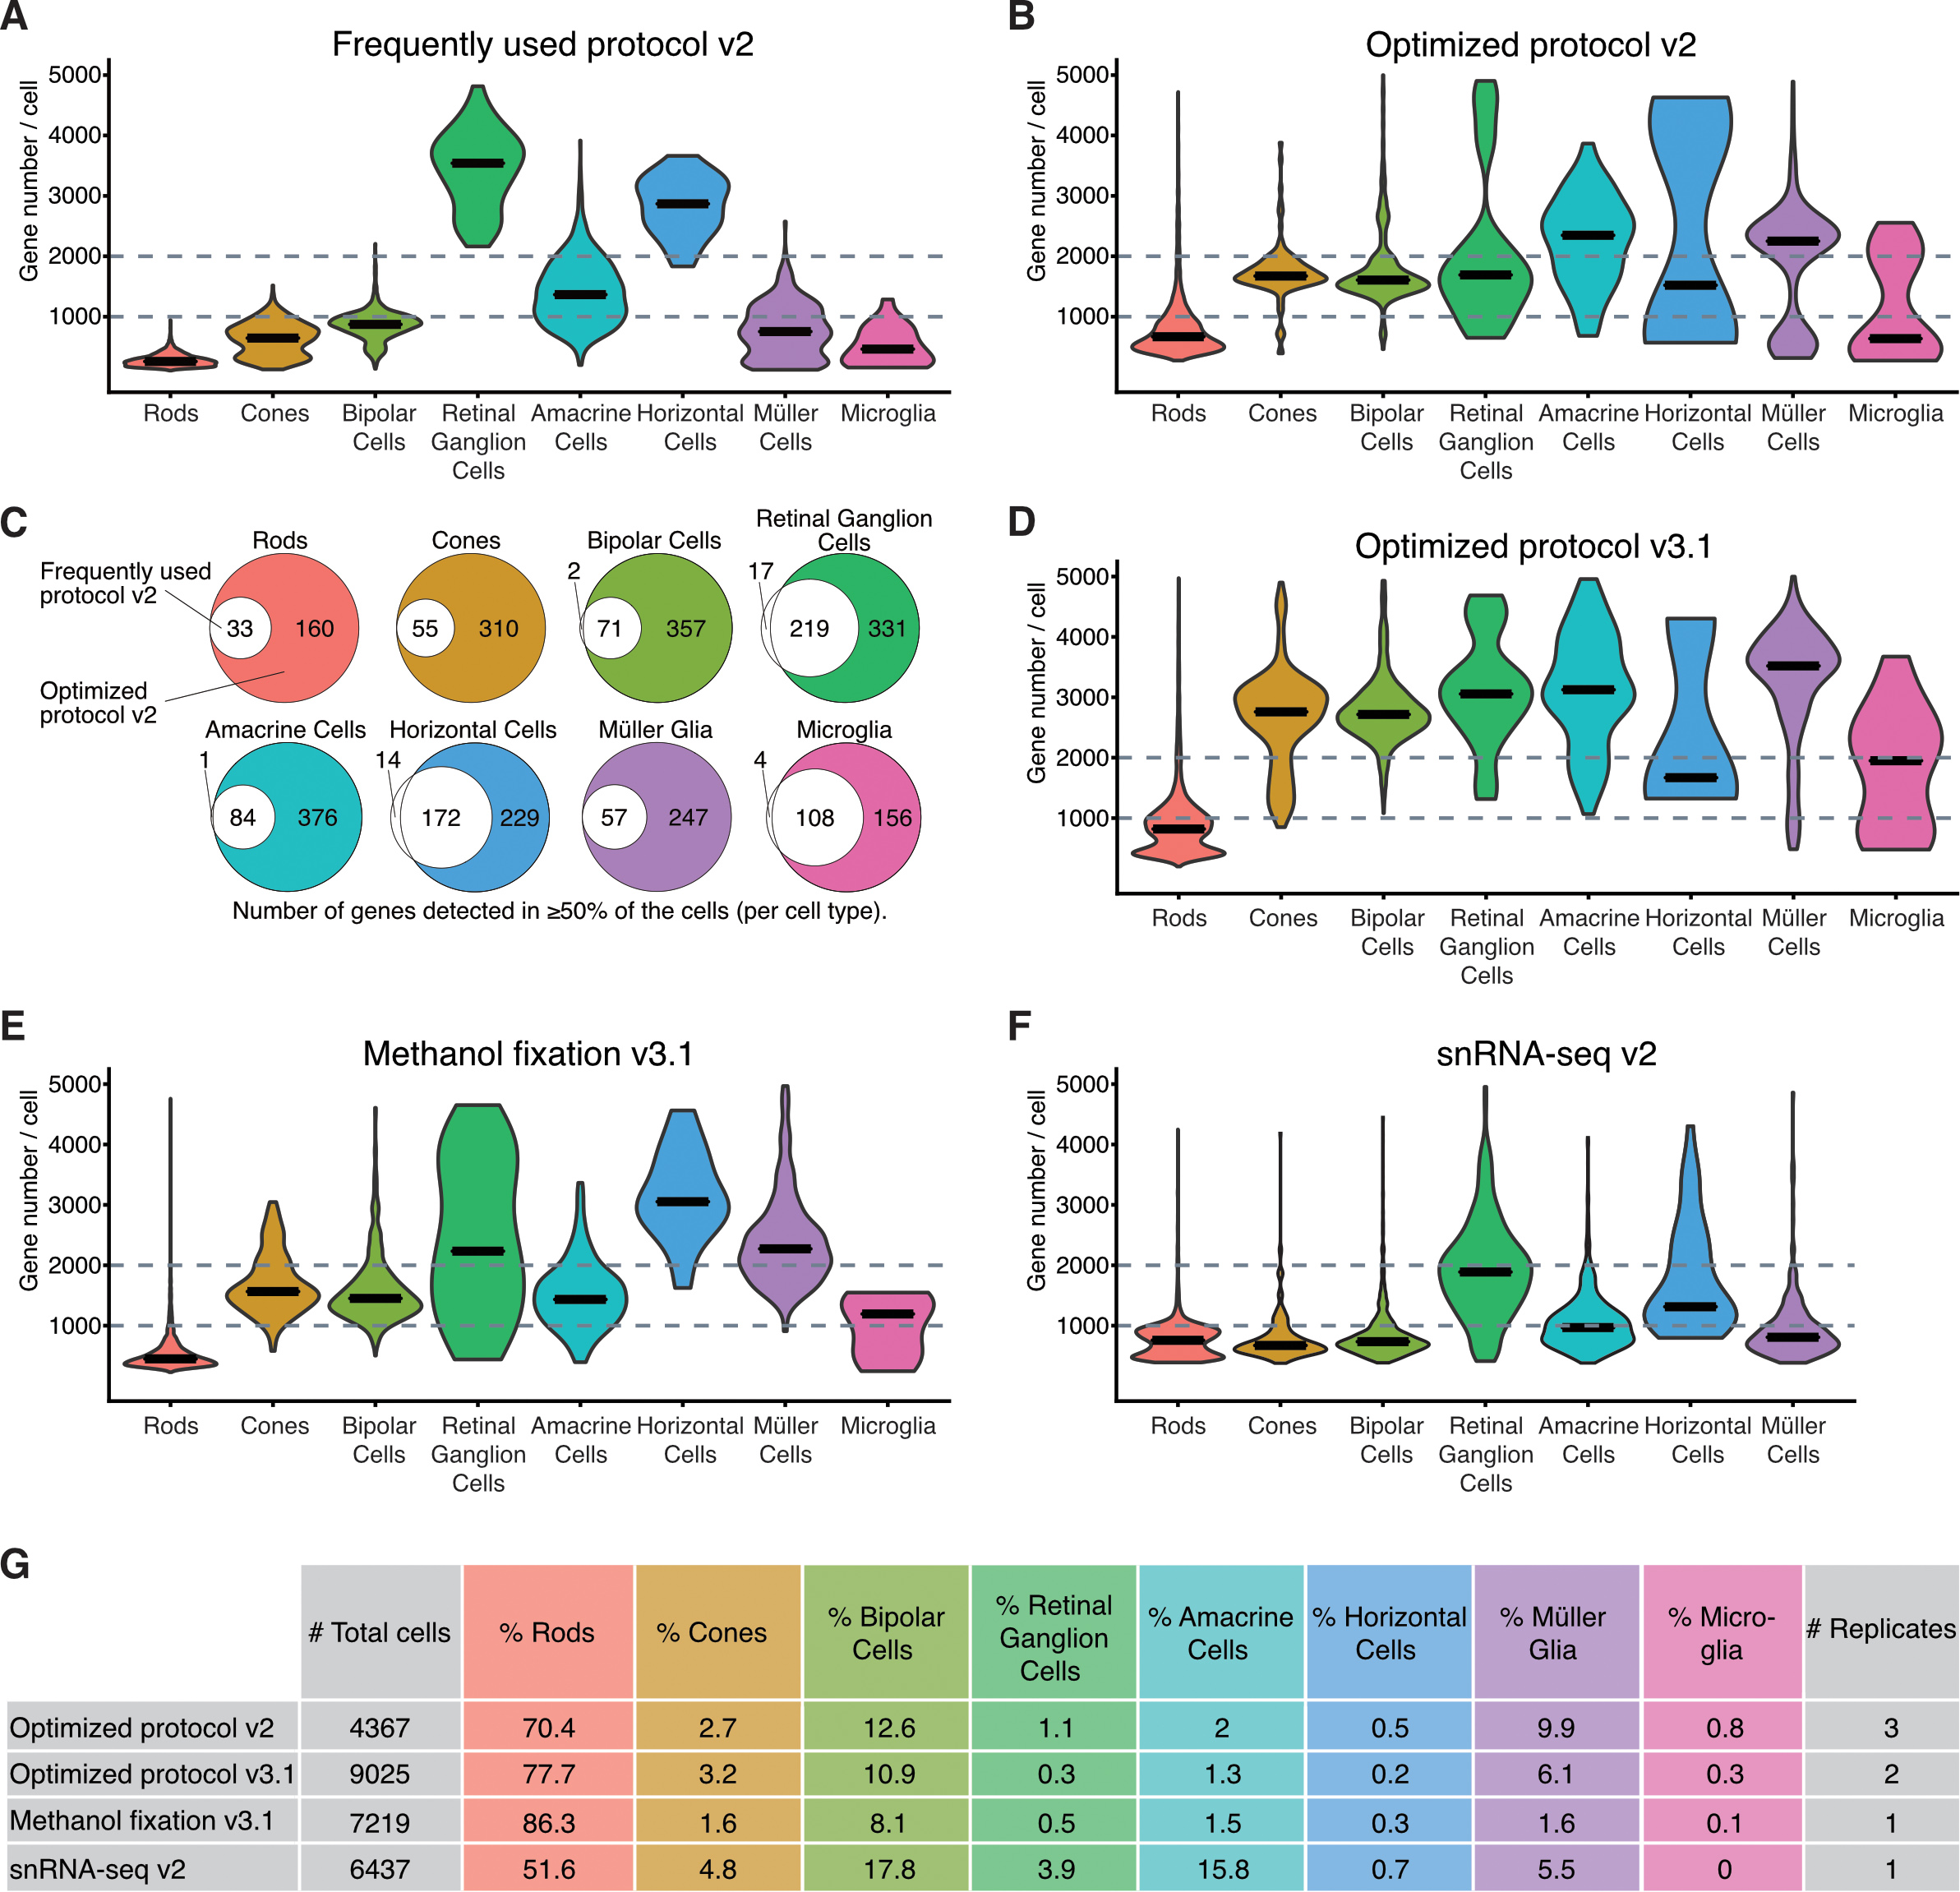
 Figure 4 of
Fadl, Mol Vis 2020; 26:705-717.
Figure 4 of
Fadl, Mol Vis 2020; 26:705-717.