Figure 3. scRNA-seq analysis of retina samples. A: Flowchart showing the retina single-cell RNA sequencing (scRNA-seq) bioinformatic analysis pipeline. White boxes indicate
commonly used steps. Gray boxes indicate additional steps included in the optimized protocol. B: Sankey plot of a published wild-type retina scRNA-seq data set (GEO accession # GSE125708). Left: cell type assignment by
the frequently used cluster-based pipeline protocol. Right: cell type assignment by the optimized unsupervised score-based
protocol. C: UMAP plots generated by scored-based cell type assignment information from (B), before and after additional filtering steps are applied. Cell clusters are colored based on the score-based cell-type assignment
identical to (B). The circle in (C) marks clusters containing mixed cell types. Numbers indicate the proportion of the different cell types.
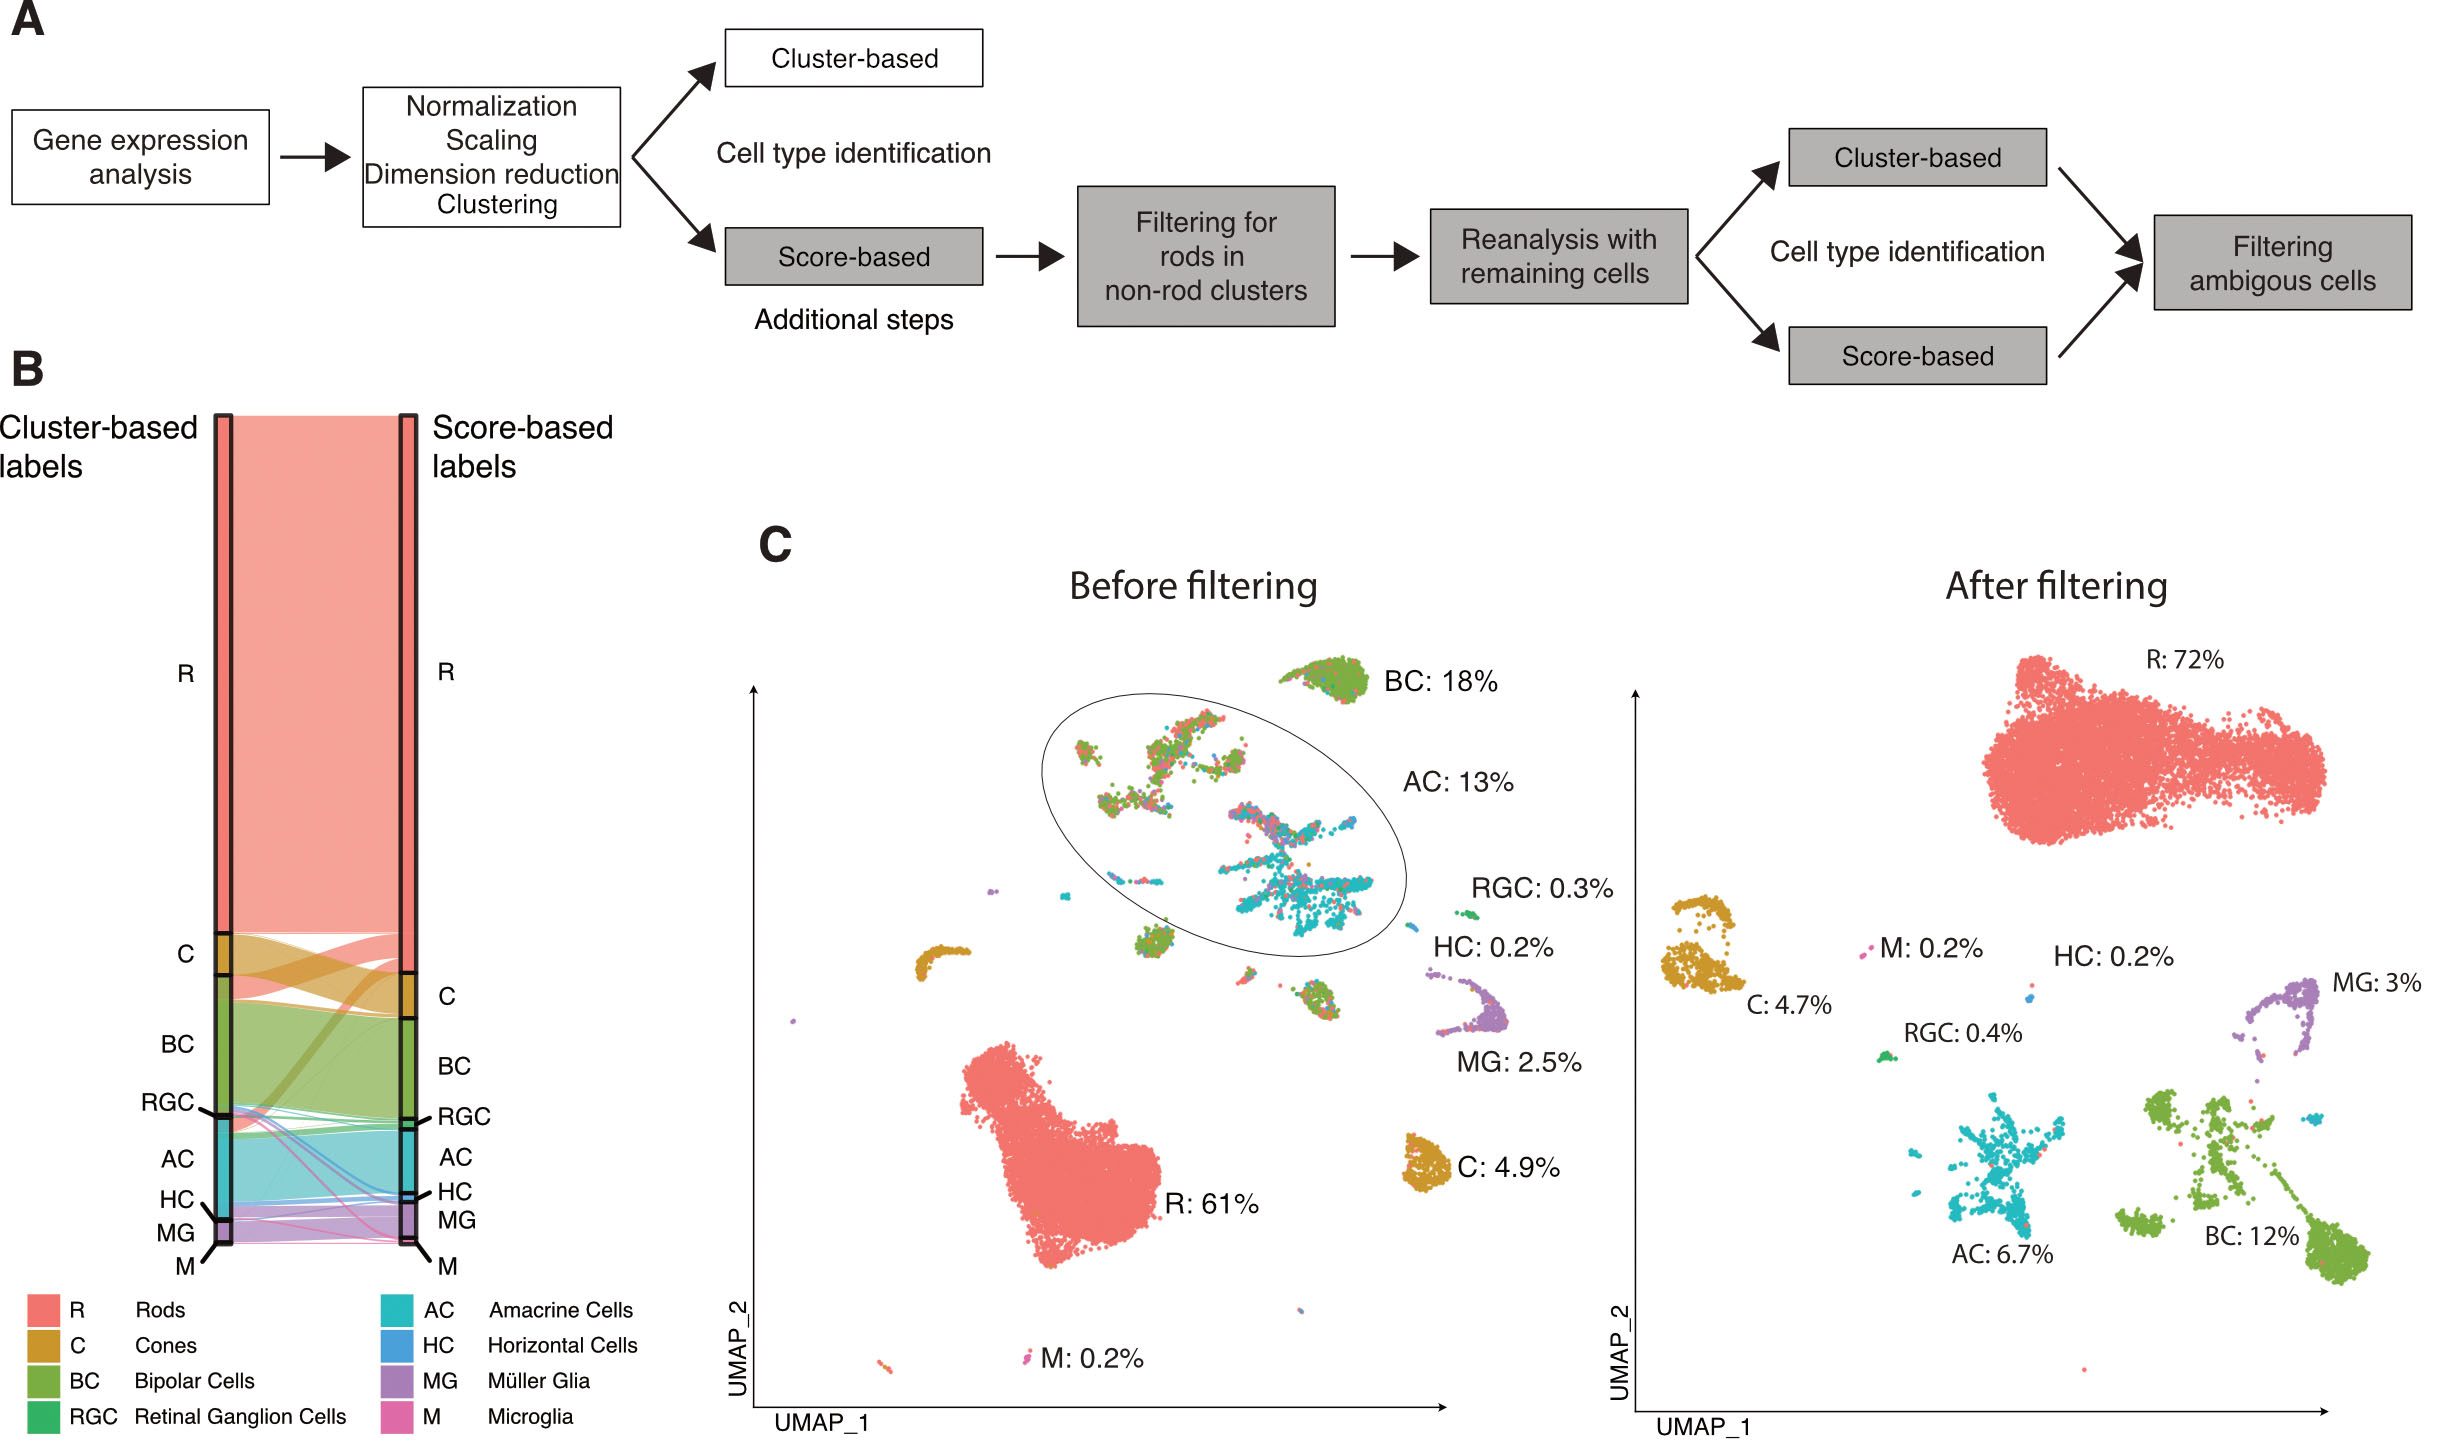
 Figure 3 of
Fadl, Mol Vis 2020; 26:705-717.
Figure 3 of
Fadl, Mol Vis 2020; 26:705-717.