Figure 2. Morphometric and cytometric analyses of dissociated retinal cells. A: Morphometric analyses of rods and ON bipolar cells. The upper panel consists of nine confocal images representative of the
distinct morphological categories that were followed for classifying rod and ON bipolar cells. First row: ON bipolar cells
including dendrites, soma and axon (left), soma and axon (center), or with rounded shape (right). Second row: rods exhibiting
inner or outer segments (length shrinkage observed). Third row: rod axons (short and thin). The stacked bar graph at the bottom
shows the percentage of cells belonging to each morphological category for retinal cell suspensions obtained following the
frequently used (F) or the optimized (O) protocol. A minimum of 200 cells per protocol and cell type were evaluated (2-3 biological
replicates per protocol). Asterisks indicate significant differences between the two protocols for dissociation used: *p<0.05,
***p<0.001, two-way analysis of variance (ANOVA) multiple comparison test. ns: not significant. B: Flow cytometric analyses of retinal cell suspensions. Each dot represents the data of a biological replicate with n = 200,000
cells acquired, and black lines indicate the mean. Cell viability (live cells) was measured using 4′,6-diamidino-2-phenylindole
(DAPI). Percentages of EGFP- and tdTomato-positive cells within each live cell population are shown. Asterisks indicate significant
differences between the two protocols for dissociation used: **p<0.01, ****p<0.0001, two-way ANOVA multiple-comparison test.
ns: not significant.
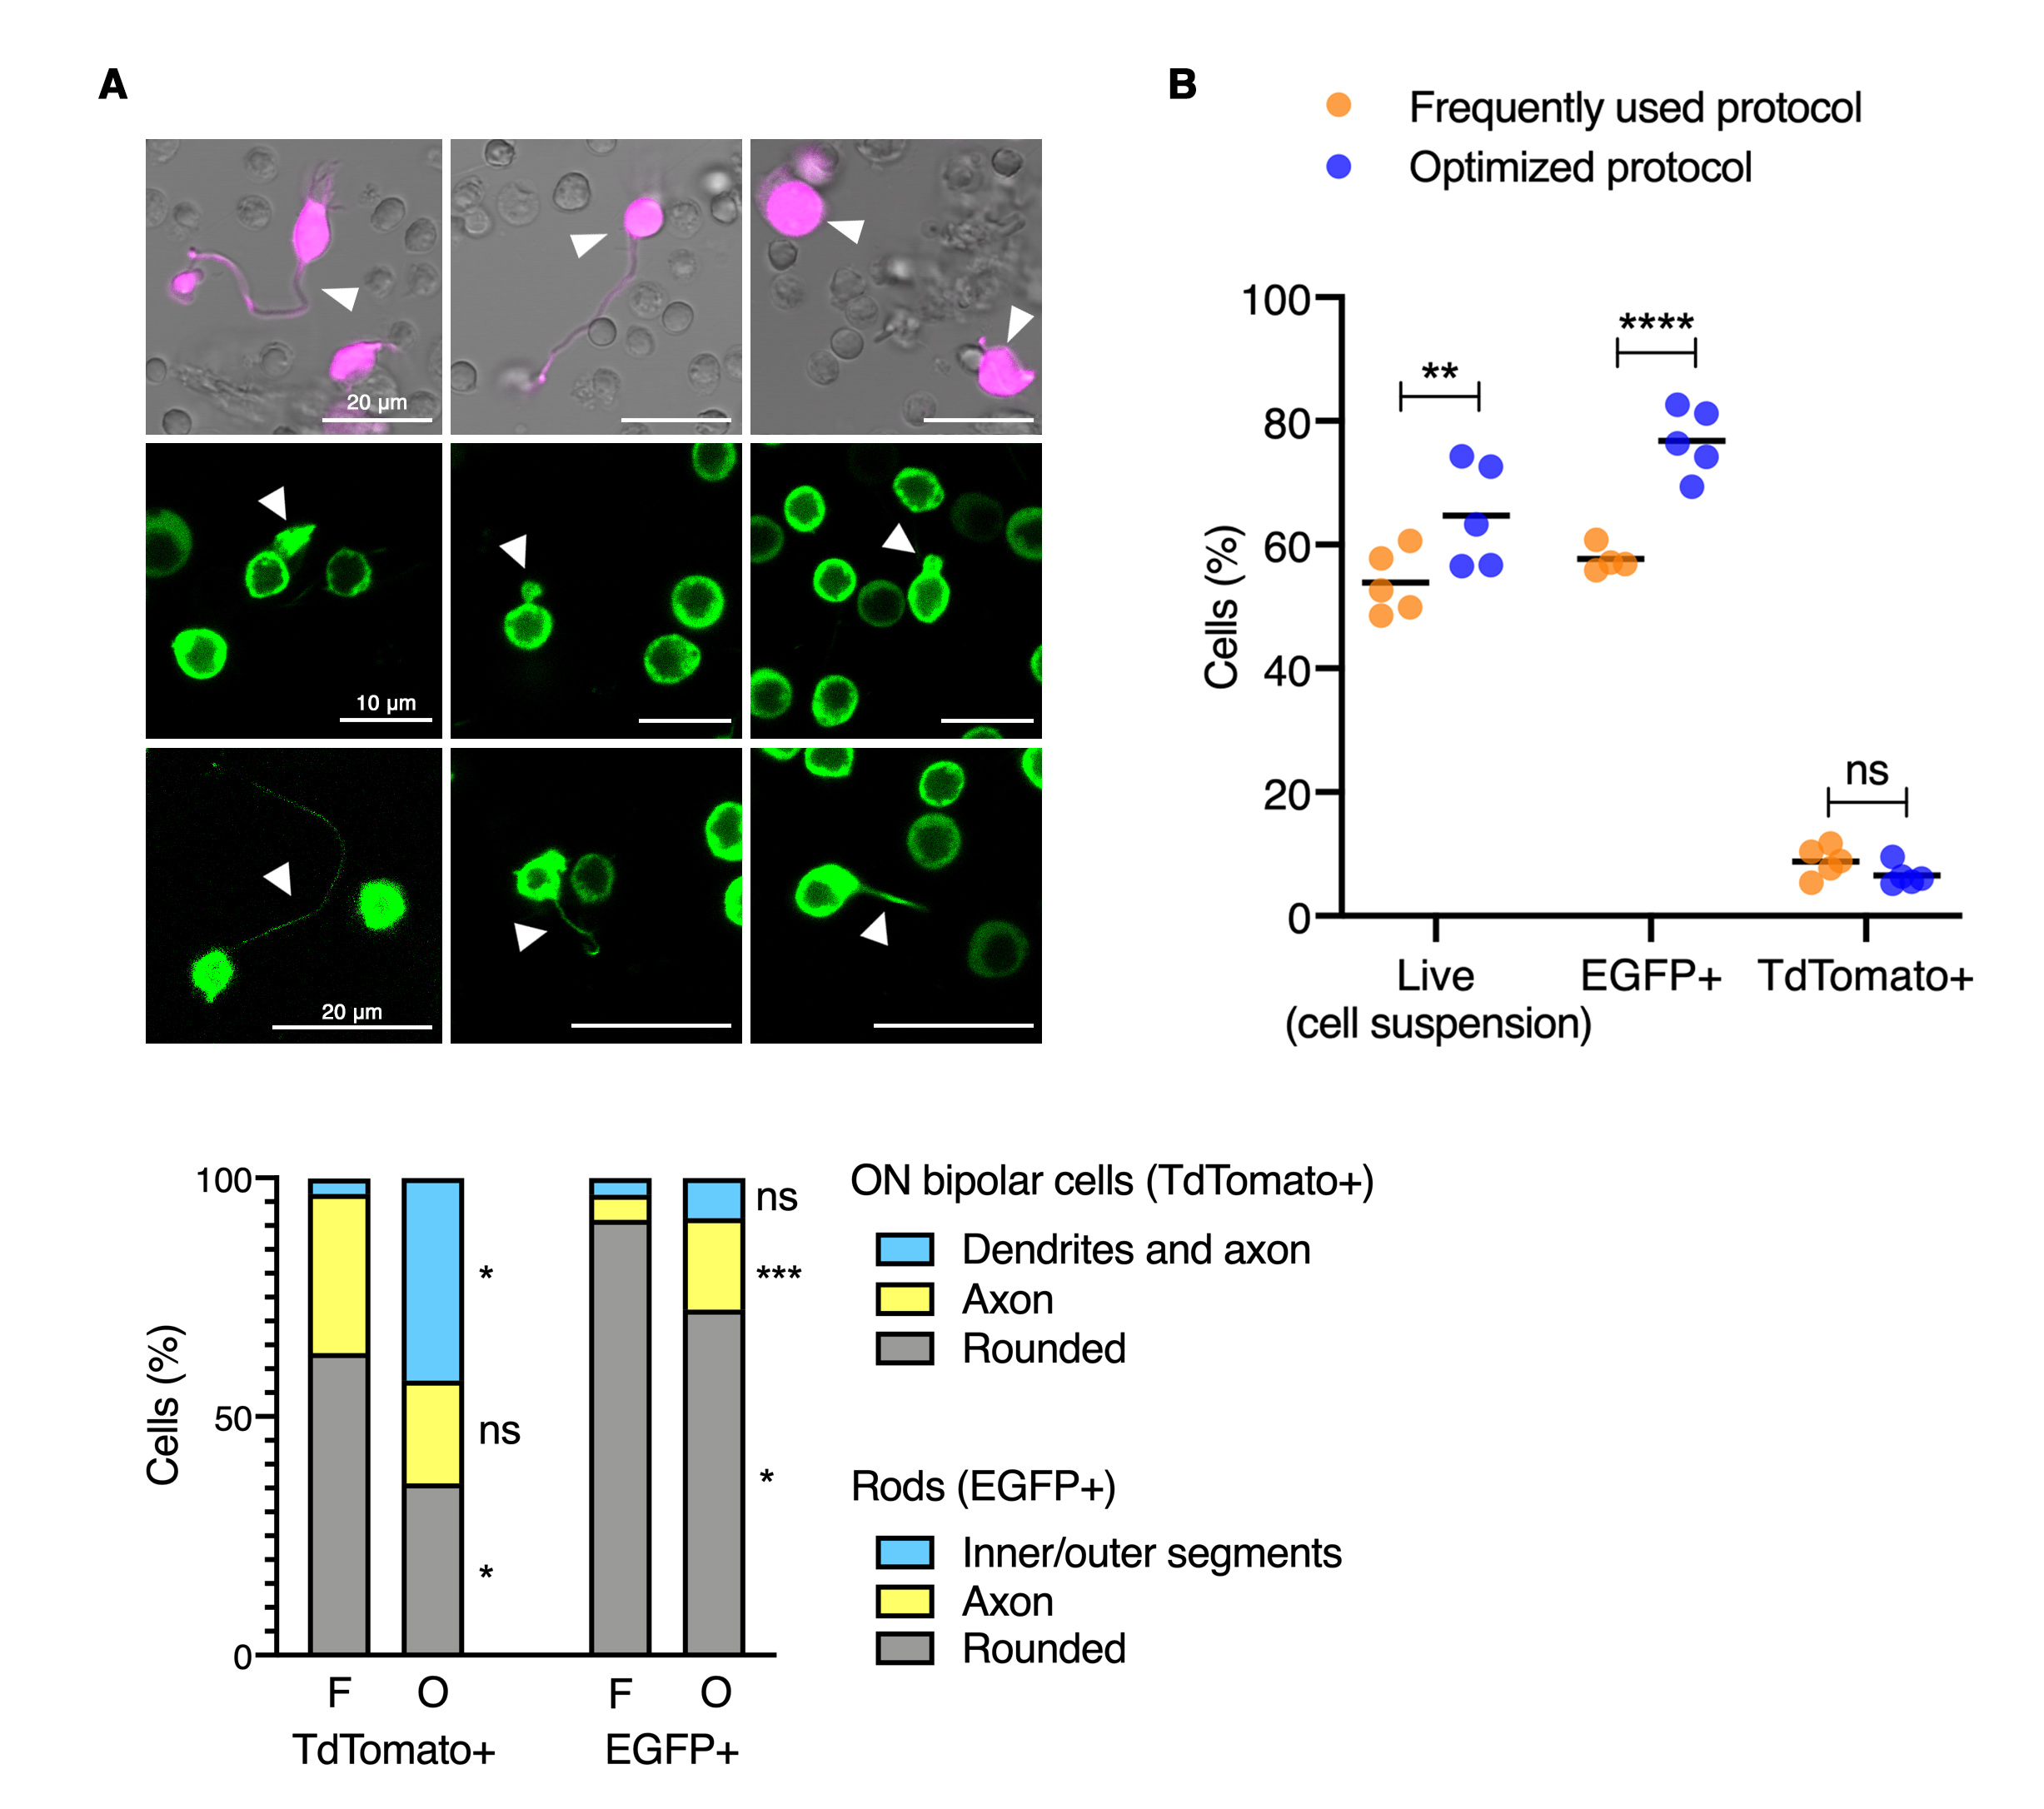
 Figure 2 of
Fadl, Mol Vis 2020; 26:705-717.
Figure 2 of
Fadl, Mol Vis 2020; 26:705-717.