Figure 1. Application of KIOM-2015E for 5 days after MCAO decreased damage to RGCs and nerve fibers. A: Infarct volume as represented by TTC staining was used to indicate the degree of ischemic brain damage. Red staining indicates
healthy tissue, as TTC does not stain areas of infarction. Relative to the sham-operated group, MCAO operation significantly
increased infarct volume, which was quantified using the ImageJ program and represented as a percentage of the total brain
volume. Data are presented as the mean ± standard error of the mean (SEM) from five individual rats in each group (n=5). ***p<0.001
versus the sham operated group. B: SD rats were treated using topical eye drops (E.D., three times daily) or via oral administration (P.O., once daily) of
KIOM-2015EW, KIOM-2015EE, or Ginexin-F. Five days after treatment, loss of RGCs was determined by immunofluorescent staining
of retinal flat mounts with antibodies against Brn3a. Quantitative analysis of RGCs in Brn3a-stained flat-mounted retinal
tissues. While the number of Brn3a-positive RGCs was significantly reduced in rats with MCAO-induced injury, KIOM-2015E application
protected RGCs from MCAO injury, as indicated by Brn3a-positive staining. The graph shows the average number of cells from
five randomly selected photographs for each group. C: SD rats underwent treatment with E.D. (three times daily) and P.O. (once daily) formulations of KIOM-2015EW, KIOM-2015EE,
or Ginexin-F. Five days after treatment, degradation of RGC nerve fibers was determined by immunofluorescent staining of retinal
flat mounts with antibodies against class III beta-tubulin (Tuj-1). In the MCAO+vehicle group, severe degradation of nerve
fibers was observed relative to that observed in the sham-operated group. However, treatment with KIOM-2015E inhibited the
degradation of RGC nerve fibers. Quantitative analysis of fluorescence density was performed in Tuj-1 -stained flat-mounted
retinal tissues. Five pictures were randomly selected per group. The average fluorescence density was calculated using the
ImageJ program and expressed as a percentage of the value observed in the sham-operated group. All images were acquired at
40× magnification. Scale bar: 200 μm. Data are presented as means ± SEM *** p<0.001 versus sham-operated, # p<0.05, ## p<0.01,
###p<0.001 versus MCAO+vehicle (E.D.). TTC, 2,3,5-triphenyltetrazolium chloride; Brn3a, brain-specific homeobox/POU domain
protein 3A; MCAO, middle cerebral artery occlusion; RGC, retinal ganglion cell; G.F., Ginexin F.
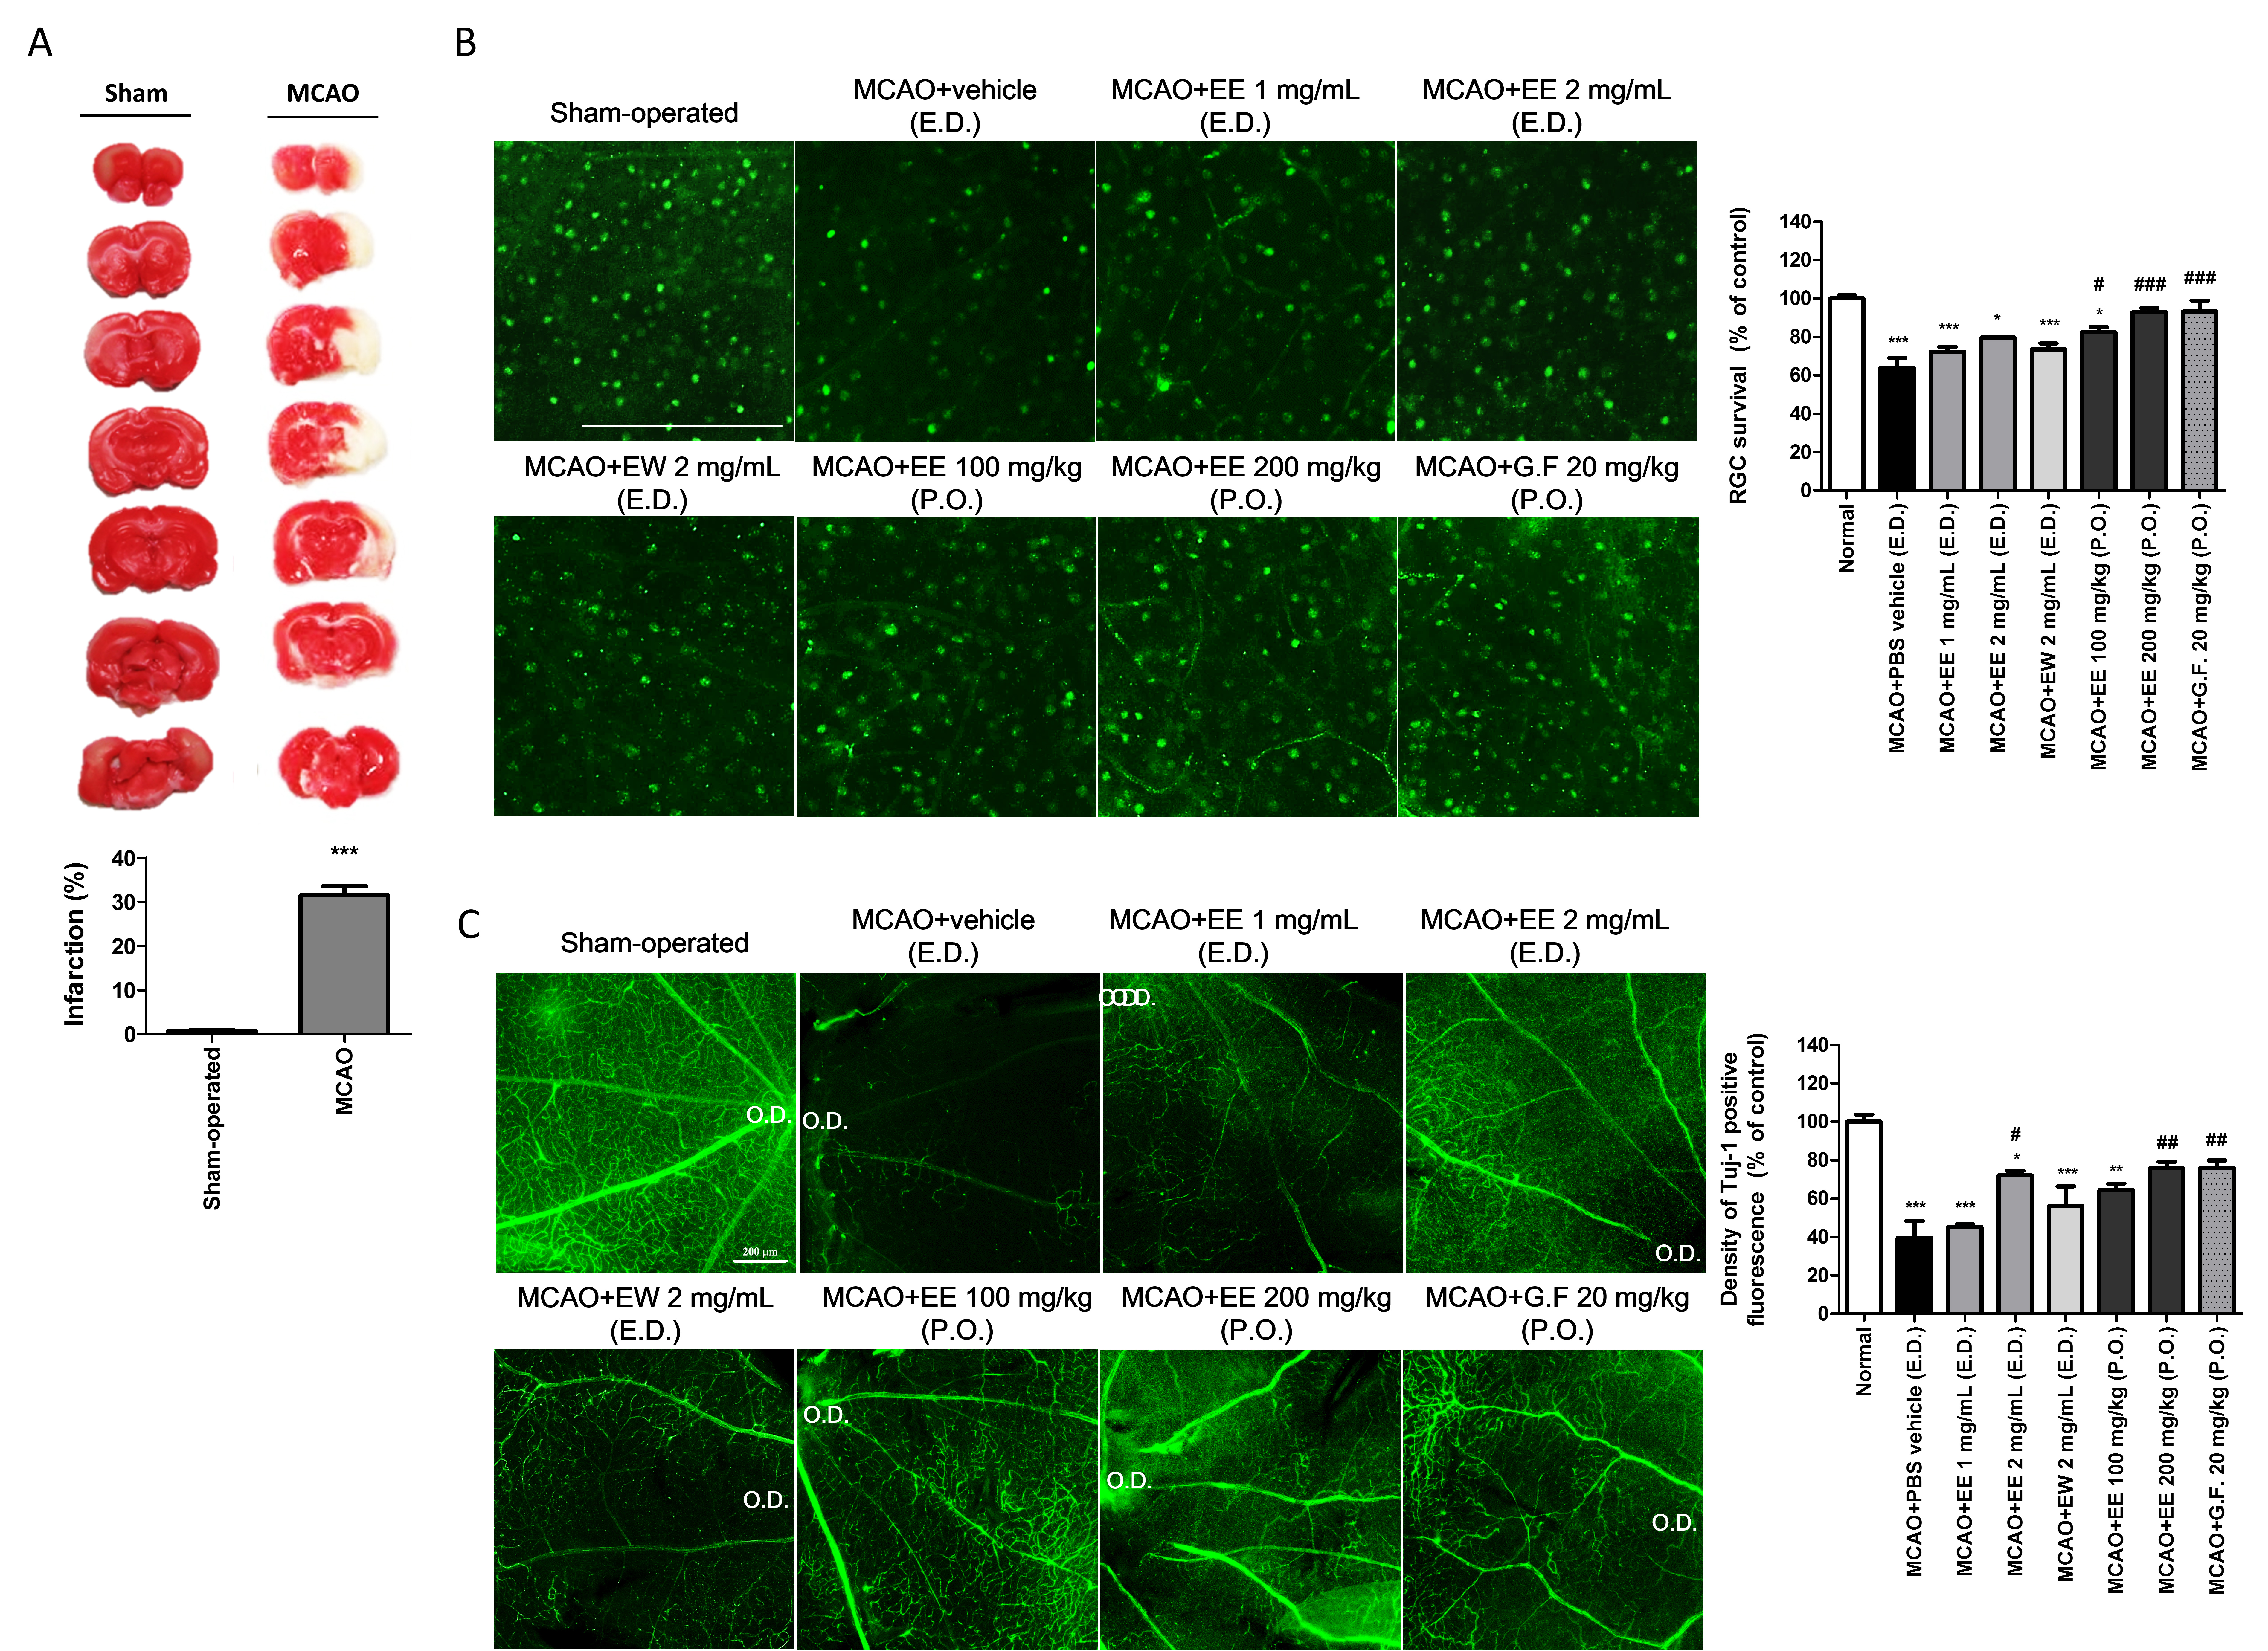
 Figure 1 of
Kim, Mol Vis 2020; 26:691-704.
Figure 1 of
Kim, Mol Vis 2020; 26:691-704.