Figure 2. Change in immunoreactivity for GFAP in Müller glia of C3 KO mice after 7 days of PD. A–D: Representative retinal cross-sections that were fluorescently immunolabeled with GFAP (green) and counterstained with bisbenzamide
(blue). There was limited immunofluorescence in the Müller glia from the dim-reared wild-type (WT; A) or C3 knockout (KO; C) mice. After PD, the WT retina sections exhibited strong immunofluorescence for GFAP in the Müller cell processes (B), which appeared less pronounced in the C3 KO retinas (D). E: GFAP mean fluorescence intensity was quantified in both cohorts at 7 days of PD, which showed a statistically significantly
higher amount of immunoreactivity for the GFAP C3 KO mice compared to the GFAP WT mice (p<0.05). F: The average length of the GFAP-positive Müller cell processes was significantly lower in the C3 KO mice compared to the
WT mice (p<0.05). Statistical significance was determined using the unpaired Student t test (p<0.05, n = 6 per group). Scale bars represent 100 μm (B and D) and 50 μm (A and C). GCL, ganglion cell layer; INL, inner nuclear layer; ONL, outer nuclear layer; RFU, relative fluorescence unit; RPE, retinal
pigment epithelium; PD, photo-oxidative damage.
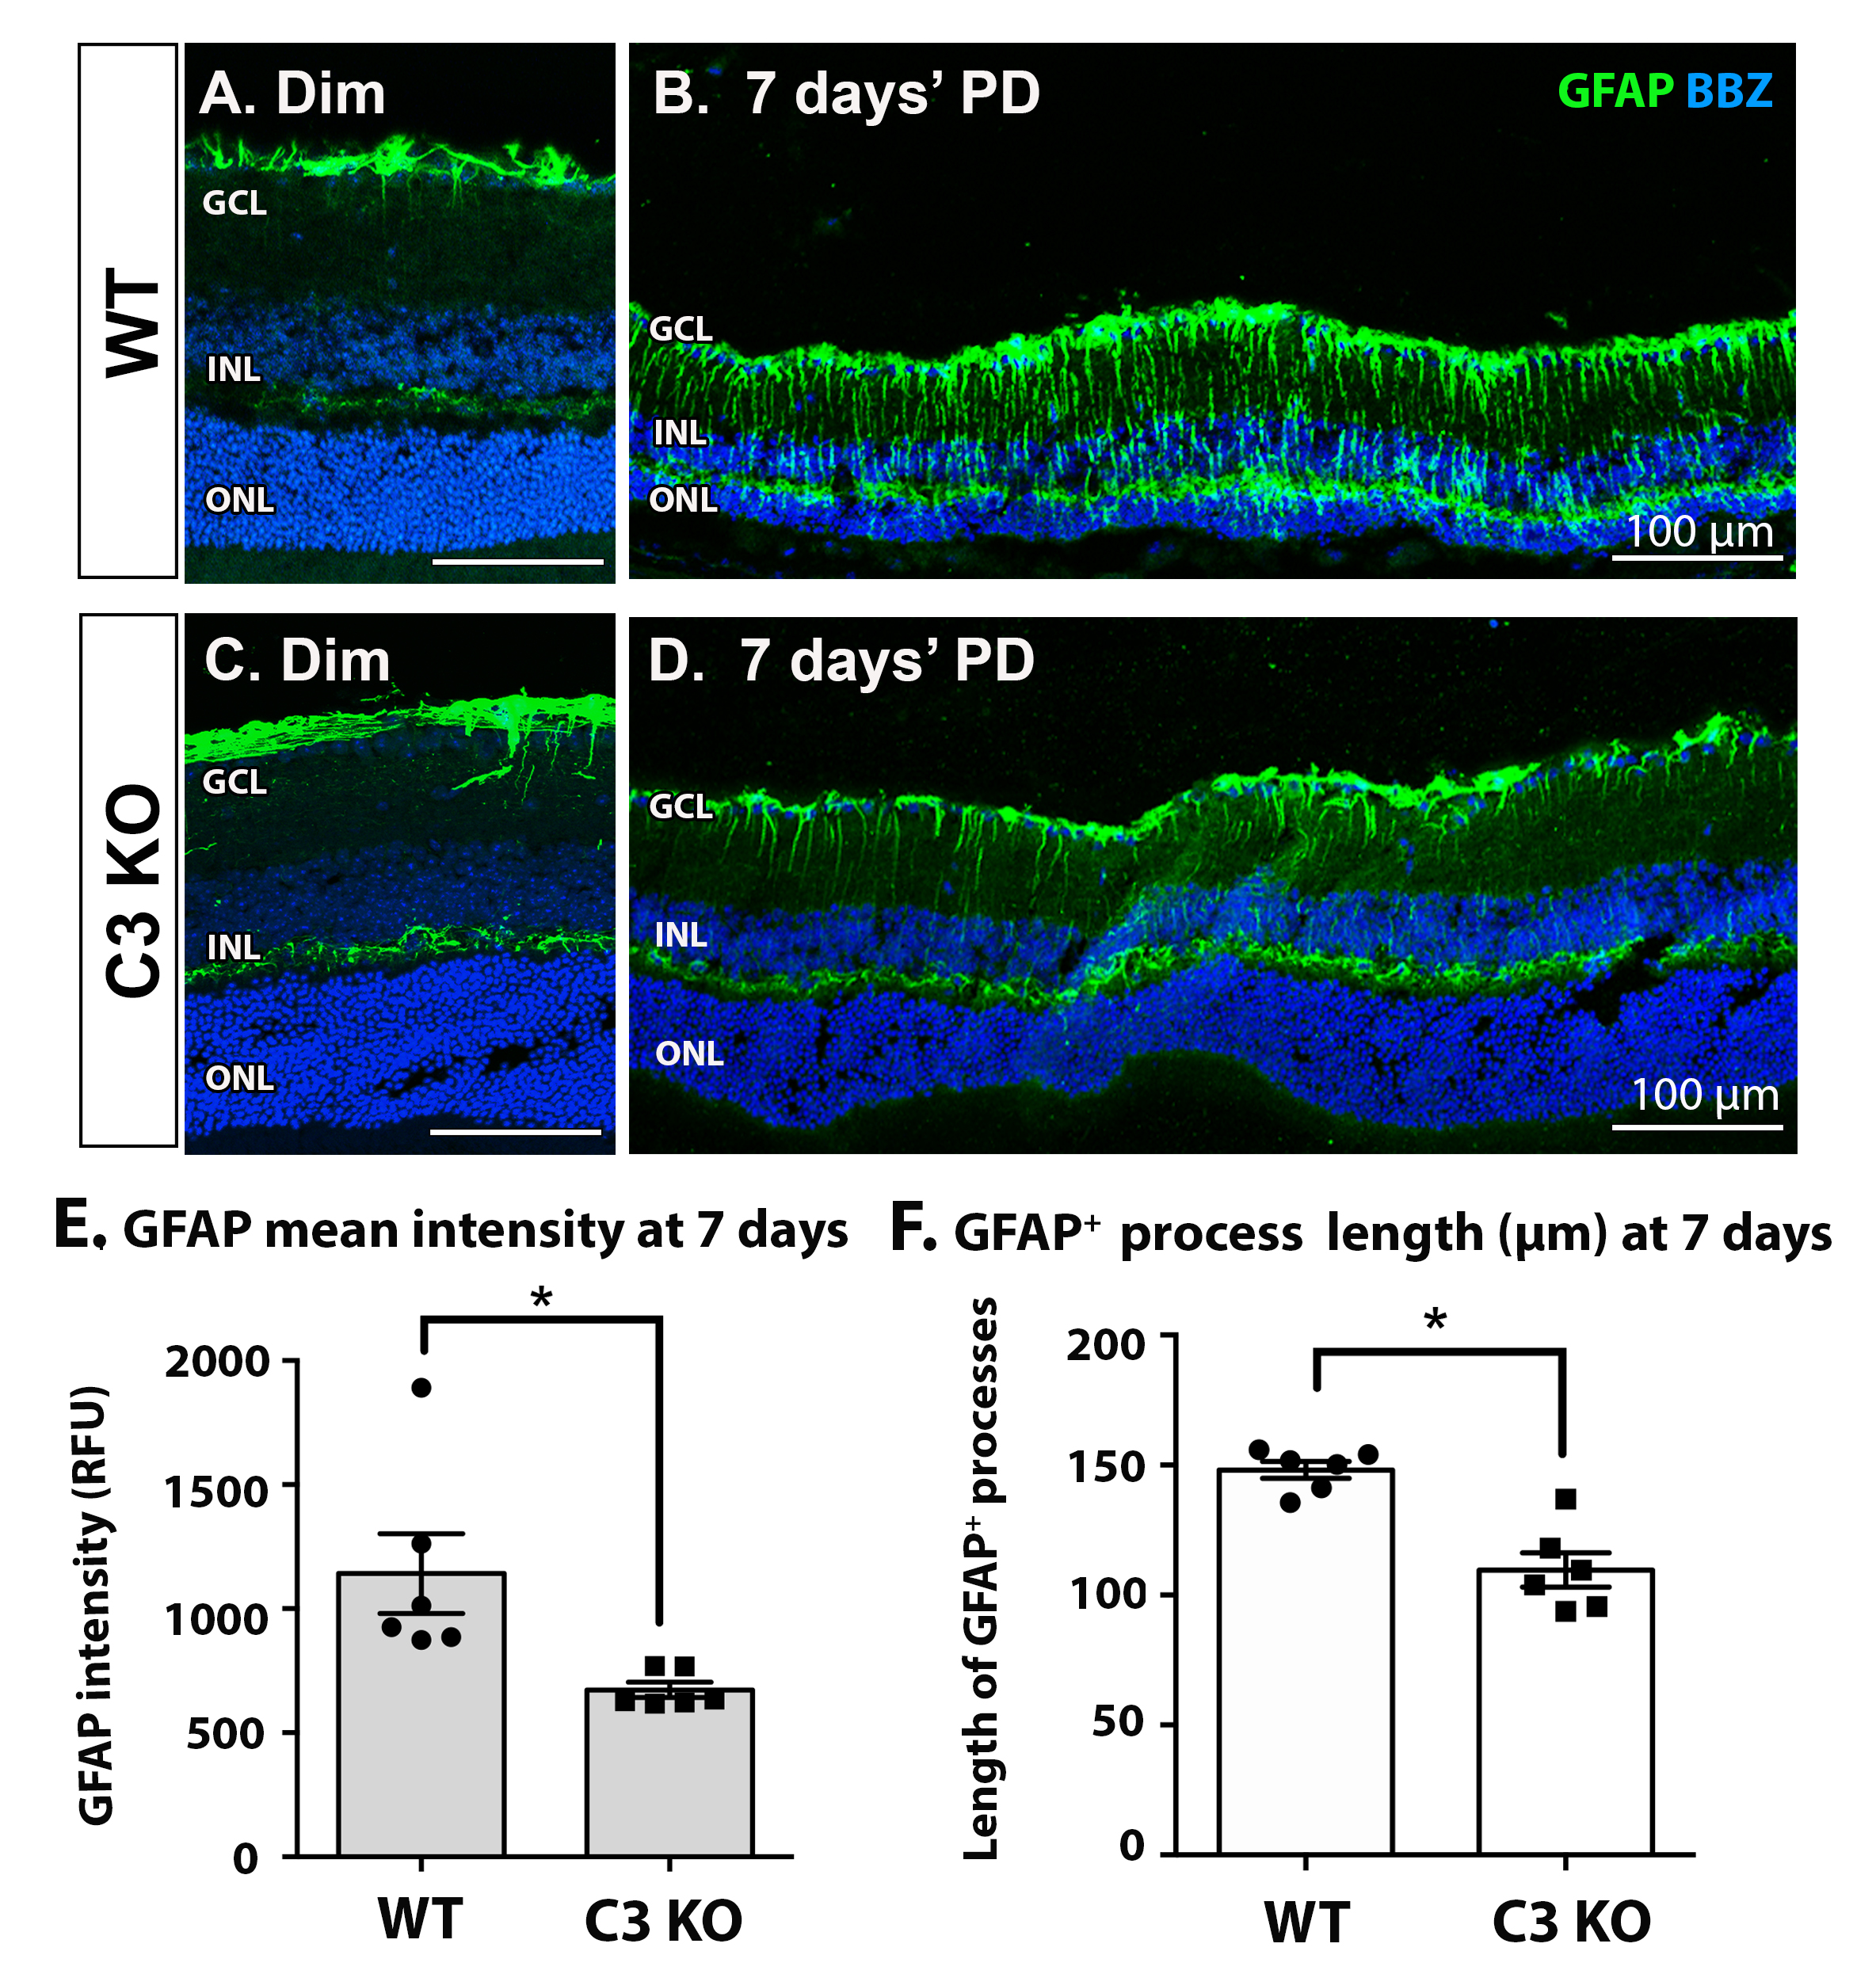
 Figure 2 of
Jiao, Mol Vis 2020; 26:679-690.
Figure 2 of
Jiao, Mol Vis 2020; 26:679-690.