Figure 3 of
Qin, Mol Vis 2020; 26:670-678.
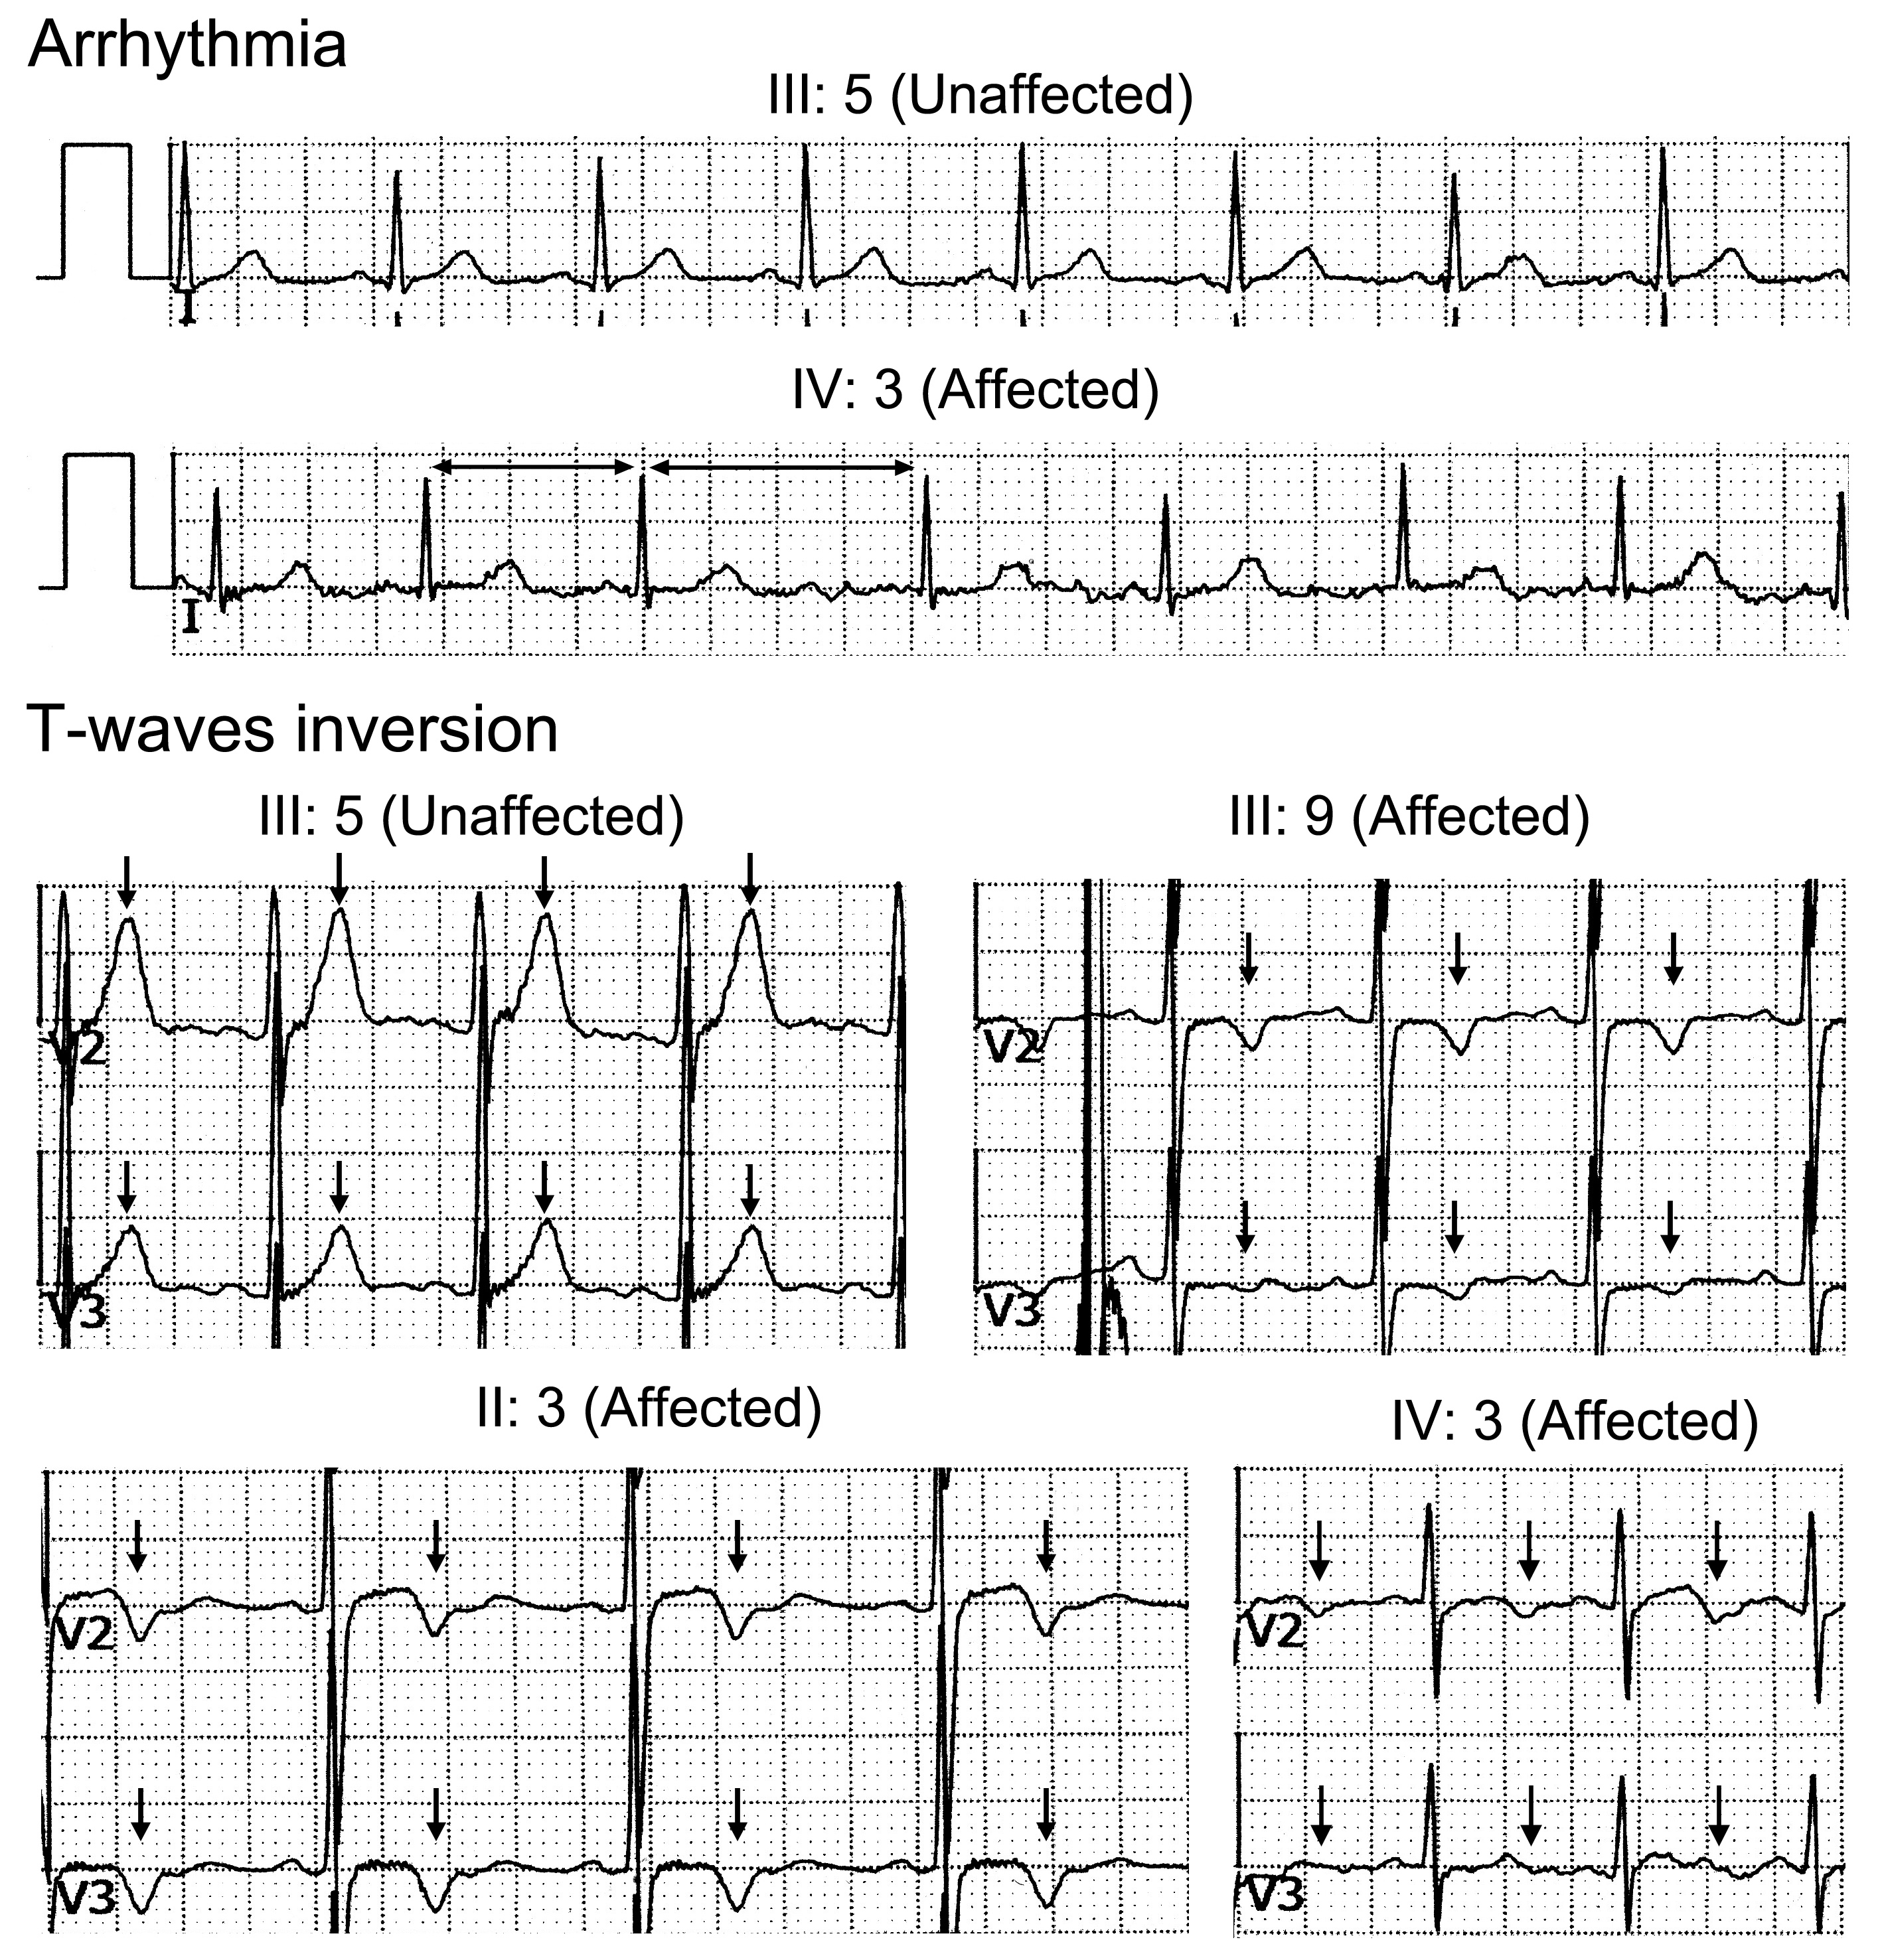
Figure 3.
The electrocardiographic abnormalities of the affected individuals in the family. IV:3 shows arrhythmia (indicated by the horizontal arrows). II:3, III:9, and IV:3 show ST-T abnormalities (indicated by arrows).
 Figure 3 of
Qin, Mol Vis 2020; 26:670-678.
Figure 3 of
Qin, Mol Vis 2020; 26:670-678.