Figure 3. Treatment with tofacitinib suppresses IFN-γ production by CD8 T cells in the eyes and spleen. Intracellular cytokine flow
cytometric staining for interferon (IFN)-γ or its transcriptional factor T-bet in eye-infiltrating (A) and spleen (B) cells, collected on day 14 post-immunization and gated on live CD45+ and CD8+ cells, after ex vivo stimulation with phorbol myristate acetate (PMA) or ionomycin and brefeldin A for 4 h. On the left,
representative data of cells from a typical mouse and on the right, summaries of four independent experiments, with each group
containing five mice. Data are shown as mean ± standard error of the mean (SEM). Statistical significance was determined using
an unpaired t test. *p<0.05.
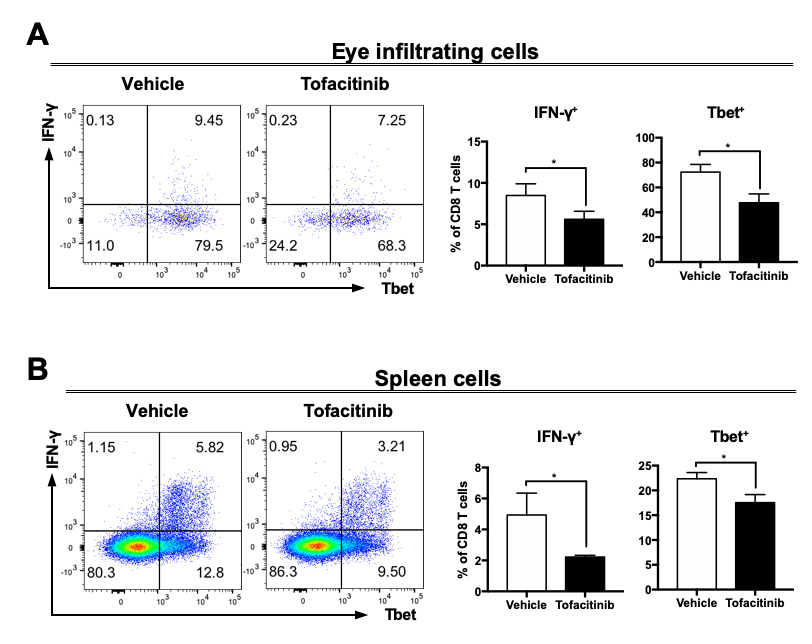
 Figure 3 of
Bing, Mol Vis 2020; 26:641-651.
Figure 3 of
Bing, Mol Vis 2020; 26:641-651.