Figure 1. Identification of the major proteins of normal and POAG human sclera. A: Representative sodium dodecyl sulfate–polyacrylamide gel electrophoresis (SDS–PAGE) images of protein extracts obtained
from non-glaucomatous sclera (control) and sclera of different patients with Stage IIIB primary open-angle glaucoma (POAG;
glaucoma). Each track contains 10 µg of total protein. Protein standards in kDa (track std) are denoted in the left column.
The positions of the bands corresponding to the major sclera proteins are indicated with arrows (the approximate positions
of bands 8, 10, and 11 are indicated in parentheses). B: The results of identification of the protein bands indicated in panel A, using tryptic peptide mass fingerprinting (matrix assisted laser desorption ionization-time of flight [MALDI-TOF] mass spectrometry
[MS]) and tandem mass spectrometry (MS/MS) of the peptides. Molecular weights (Mr) and accession numbers (UniProt) of the
proteins, the identification scores (Score), and the number of detected peptides (Pept) and sequence coverage data in % (Cov)
are provided.
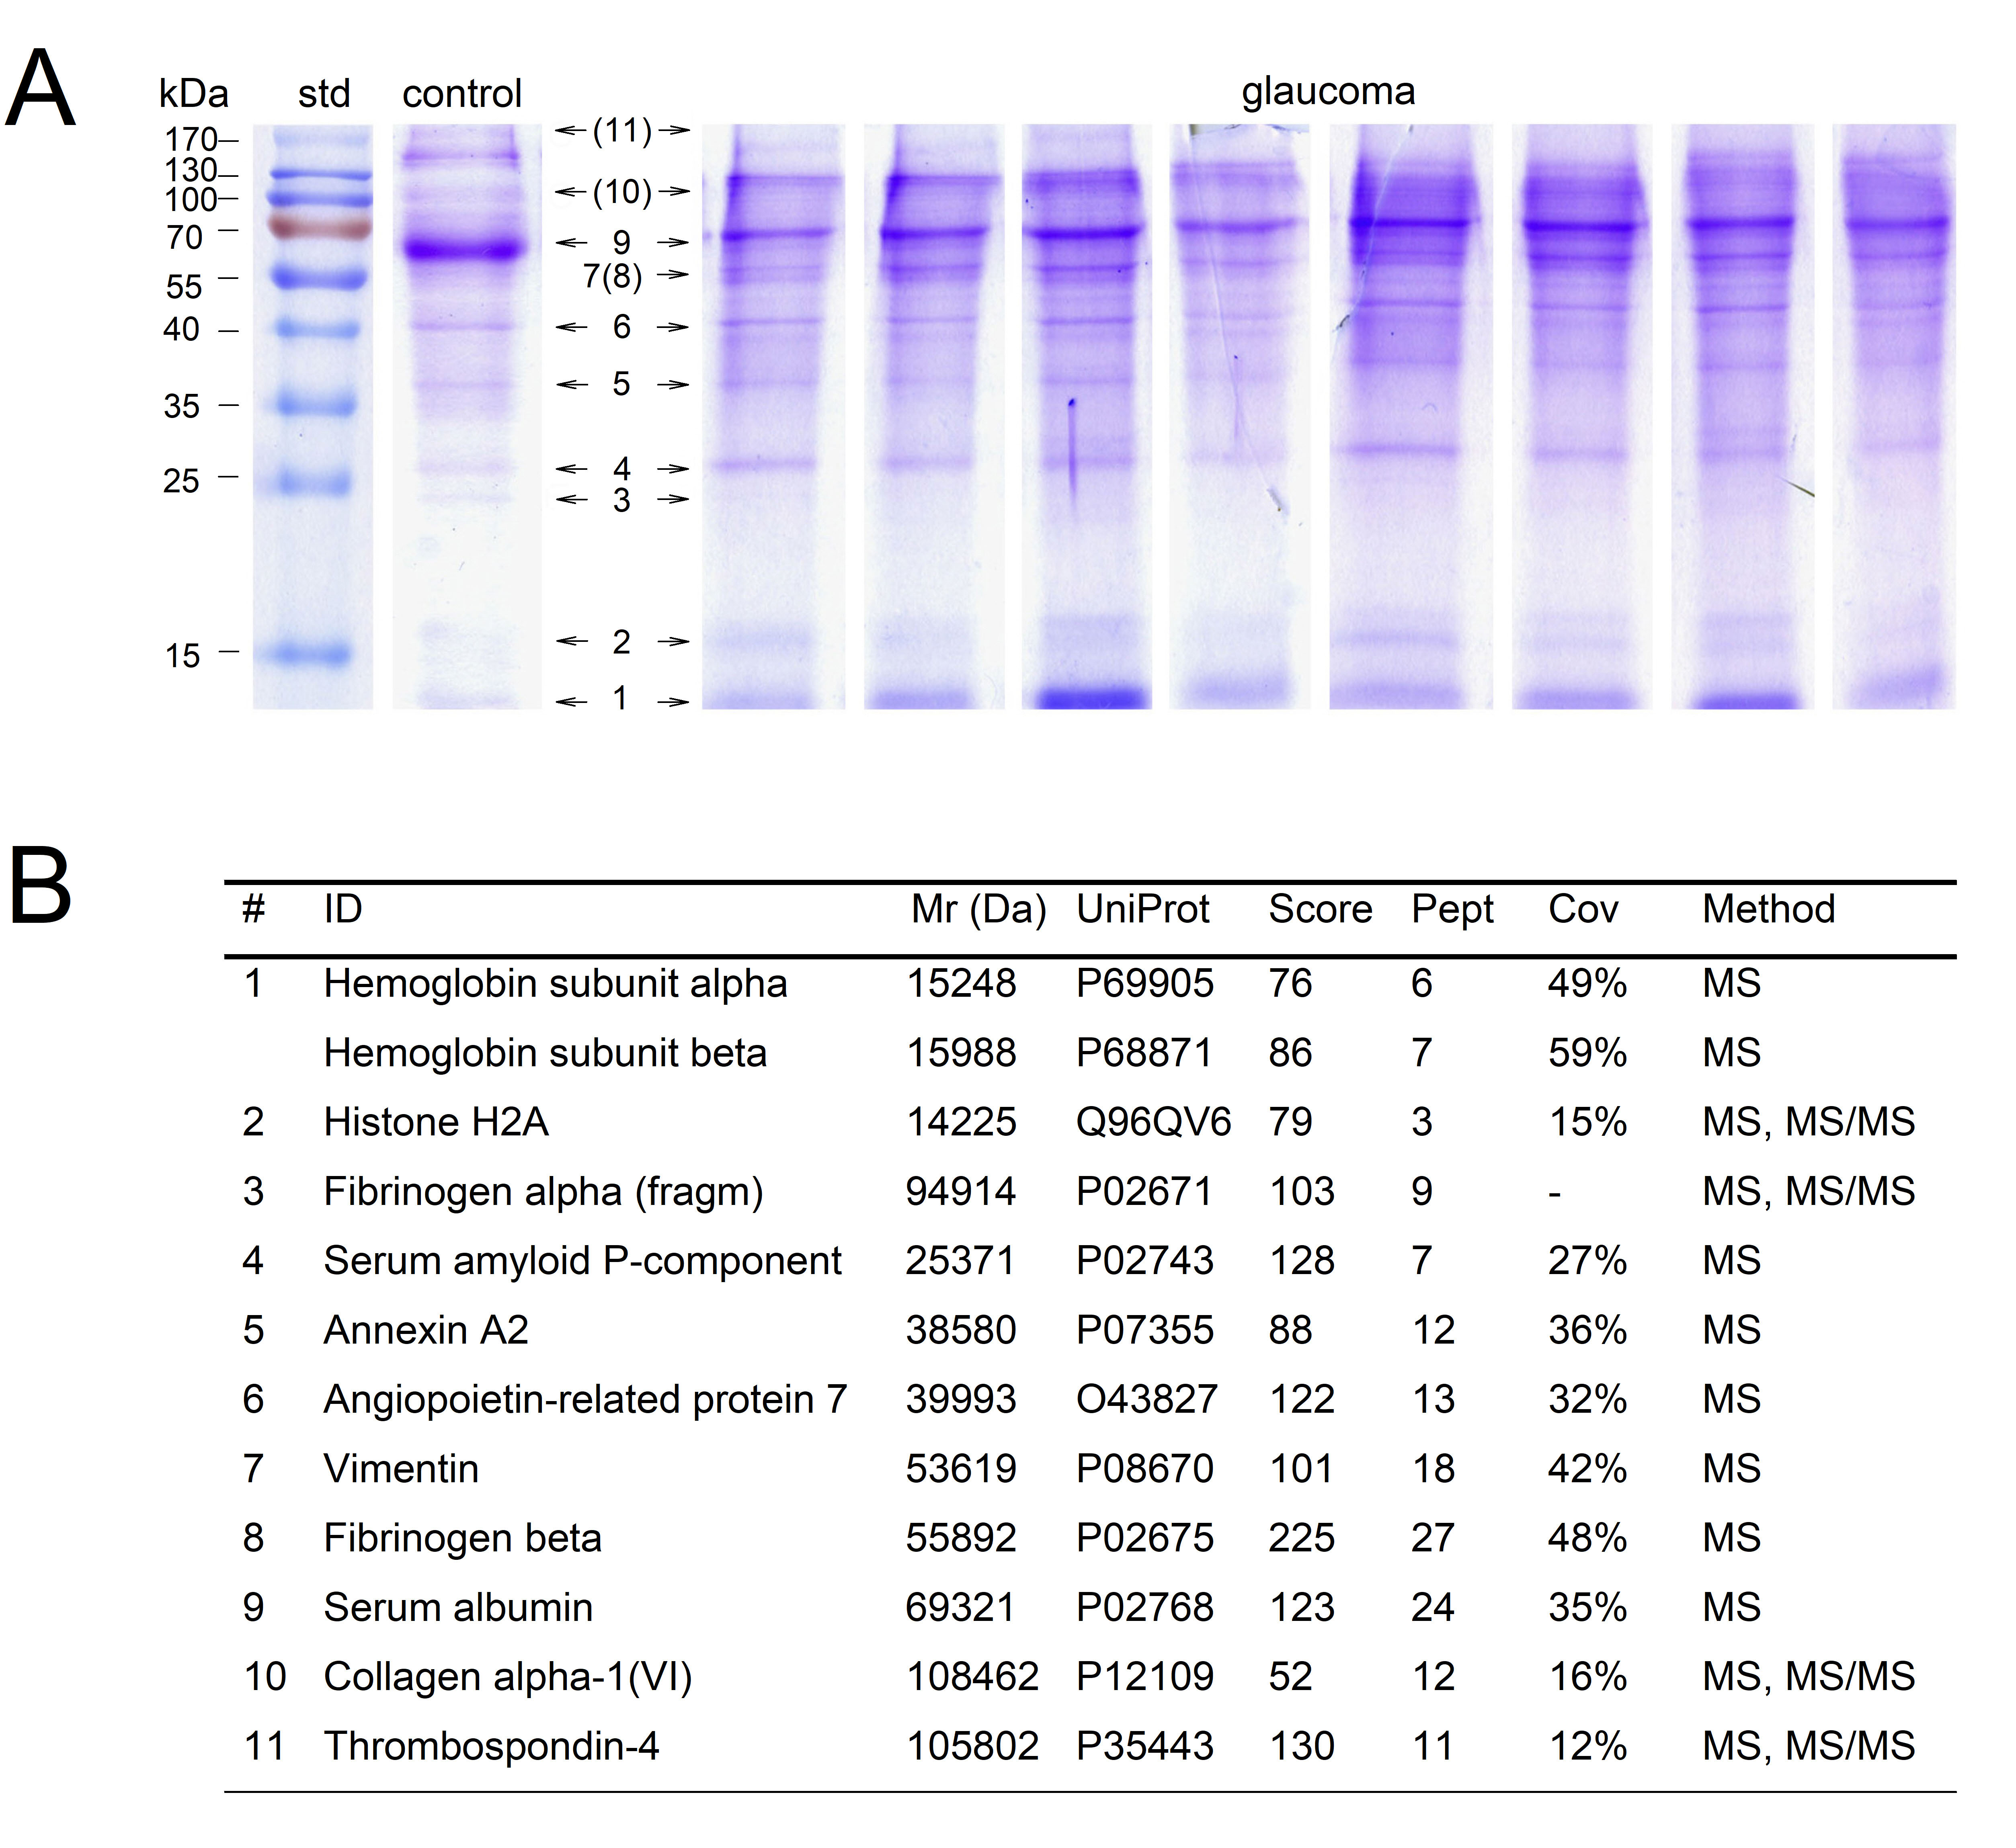
 Figure 1 of
Iomdina, Mol Vis 2020; 26:623-640.
Figure 1 of
Iomdina, Mol Vis 2020; 26:623-640.