Figure 4. Representative confocal images of filensin distributions on the long sides of hexagonal single fibers were collected from
zone I, zone II, and zone III of lens pieces double-labeled with anti-filensin antibody (red) and fluorescein (FITC)-phalloidin
(green). D, E, and F filensin signal intensity in white-box regions in images (A, B, and C) were scanned, and the fibers of zone II and zone III displayed uneven patterns. Scale bar: 4 μm.
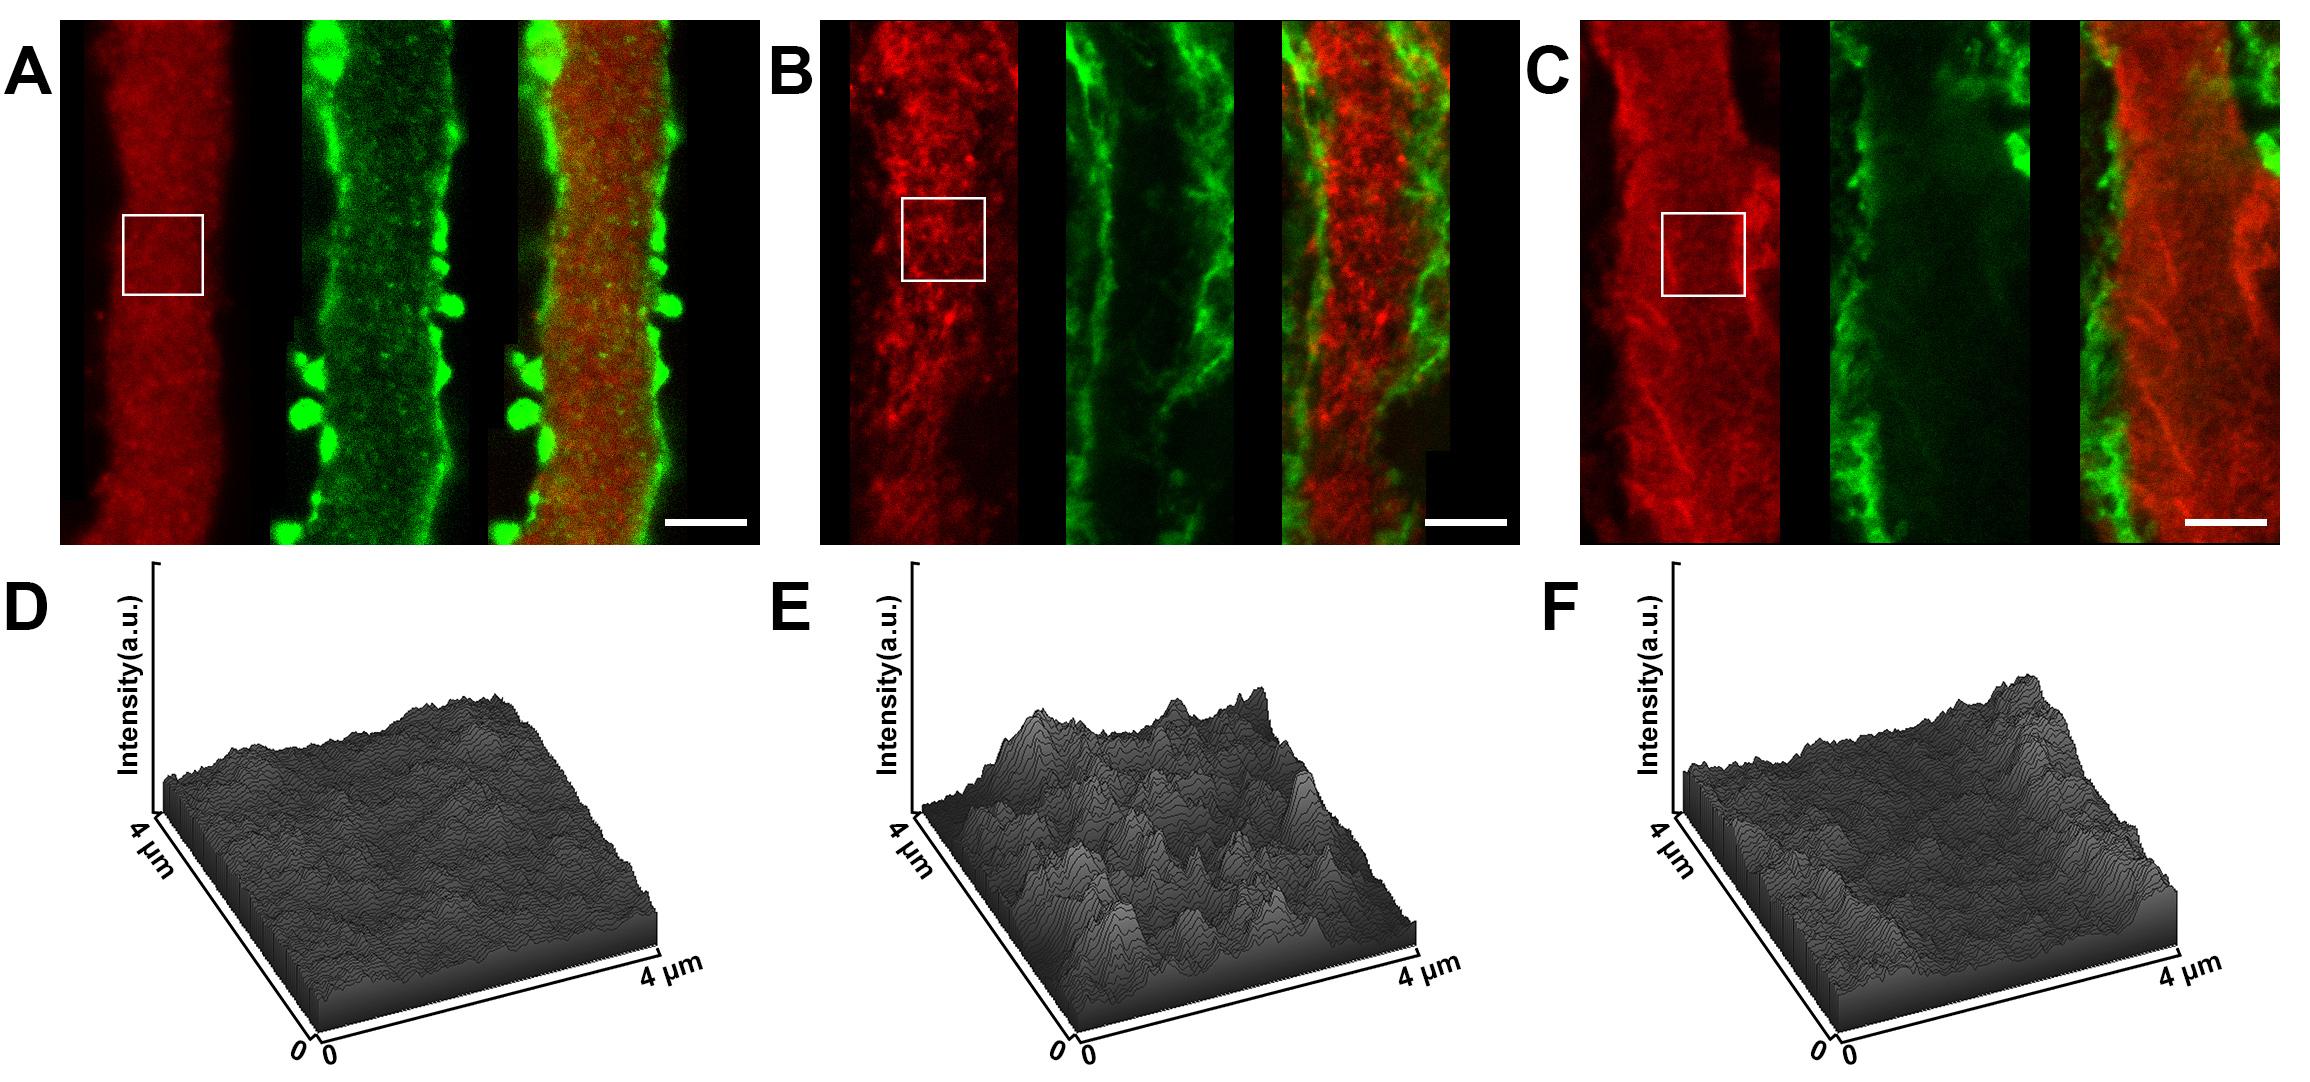
 Figure 4 of
Li, Mol Vis 2020; 26:603-612.
Figure 4 of
Li, Mol Vis 2020; 26:603-612.