Figure 1. Formation of cold cataract in lenses of P14 mice. Representative anterior-view images of B6 wild-type (B6WT, A), 129 wild-type (129WT, B), and B6 filensin knockout (filensin KO, C) lenses at 37 °C, 25 °C, and 4 °C. Cataracts (white opacity in the lens) appeared in the 25 °C and 4 °C treated B6WT lenses
but only in the 4 °C treated 129WT lens and 4 °C treated B6 filensin KO lens. These lens images were quantitatively measured
with ImageJ with line scanning for cataract intensity (y-axis) versus the lens middle plane (x-axis) from the left surface
(−1 on the graphs) to the right surface (+1 on the graphs). The lens center is marked as 0; the blue line is for 4 °C, the
red line for 25 °C, and the black line for 37 °C in the B6WT (D), 129WT (E), and B6 filensin KO (F) lenses. Bar graphs show a statistic comparison of the diameters of the cold cataracts (G). The 25 °C induced cold cataract is statistically significantly smaller than all 4 °C induced cold cataracts (n = 4, ****p≤0.0001).
Scale bar for A–C, 0.5 μm. Statistical significance was determined with one-way analysis of variance (ANOVA) with Tukey’s post-hoc test. **p≤0.01,
***p≤0.001, ****p≤0.0001.
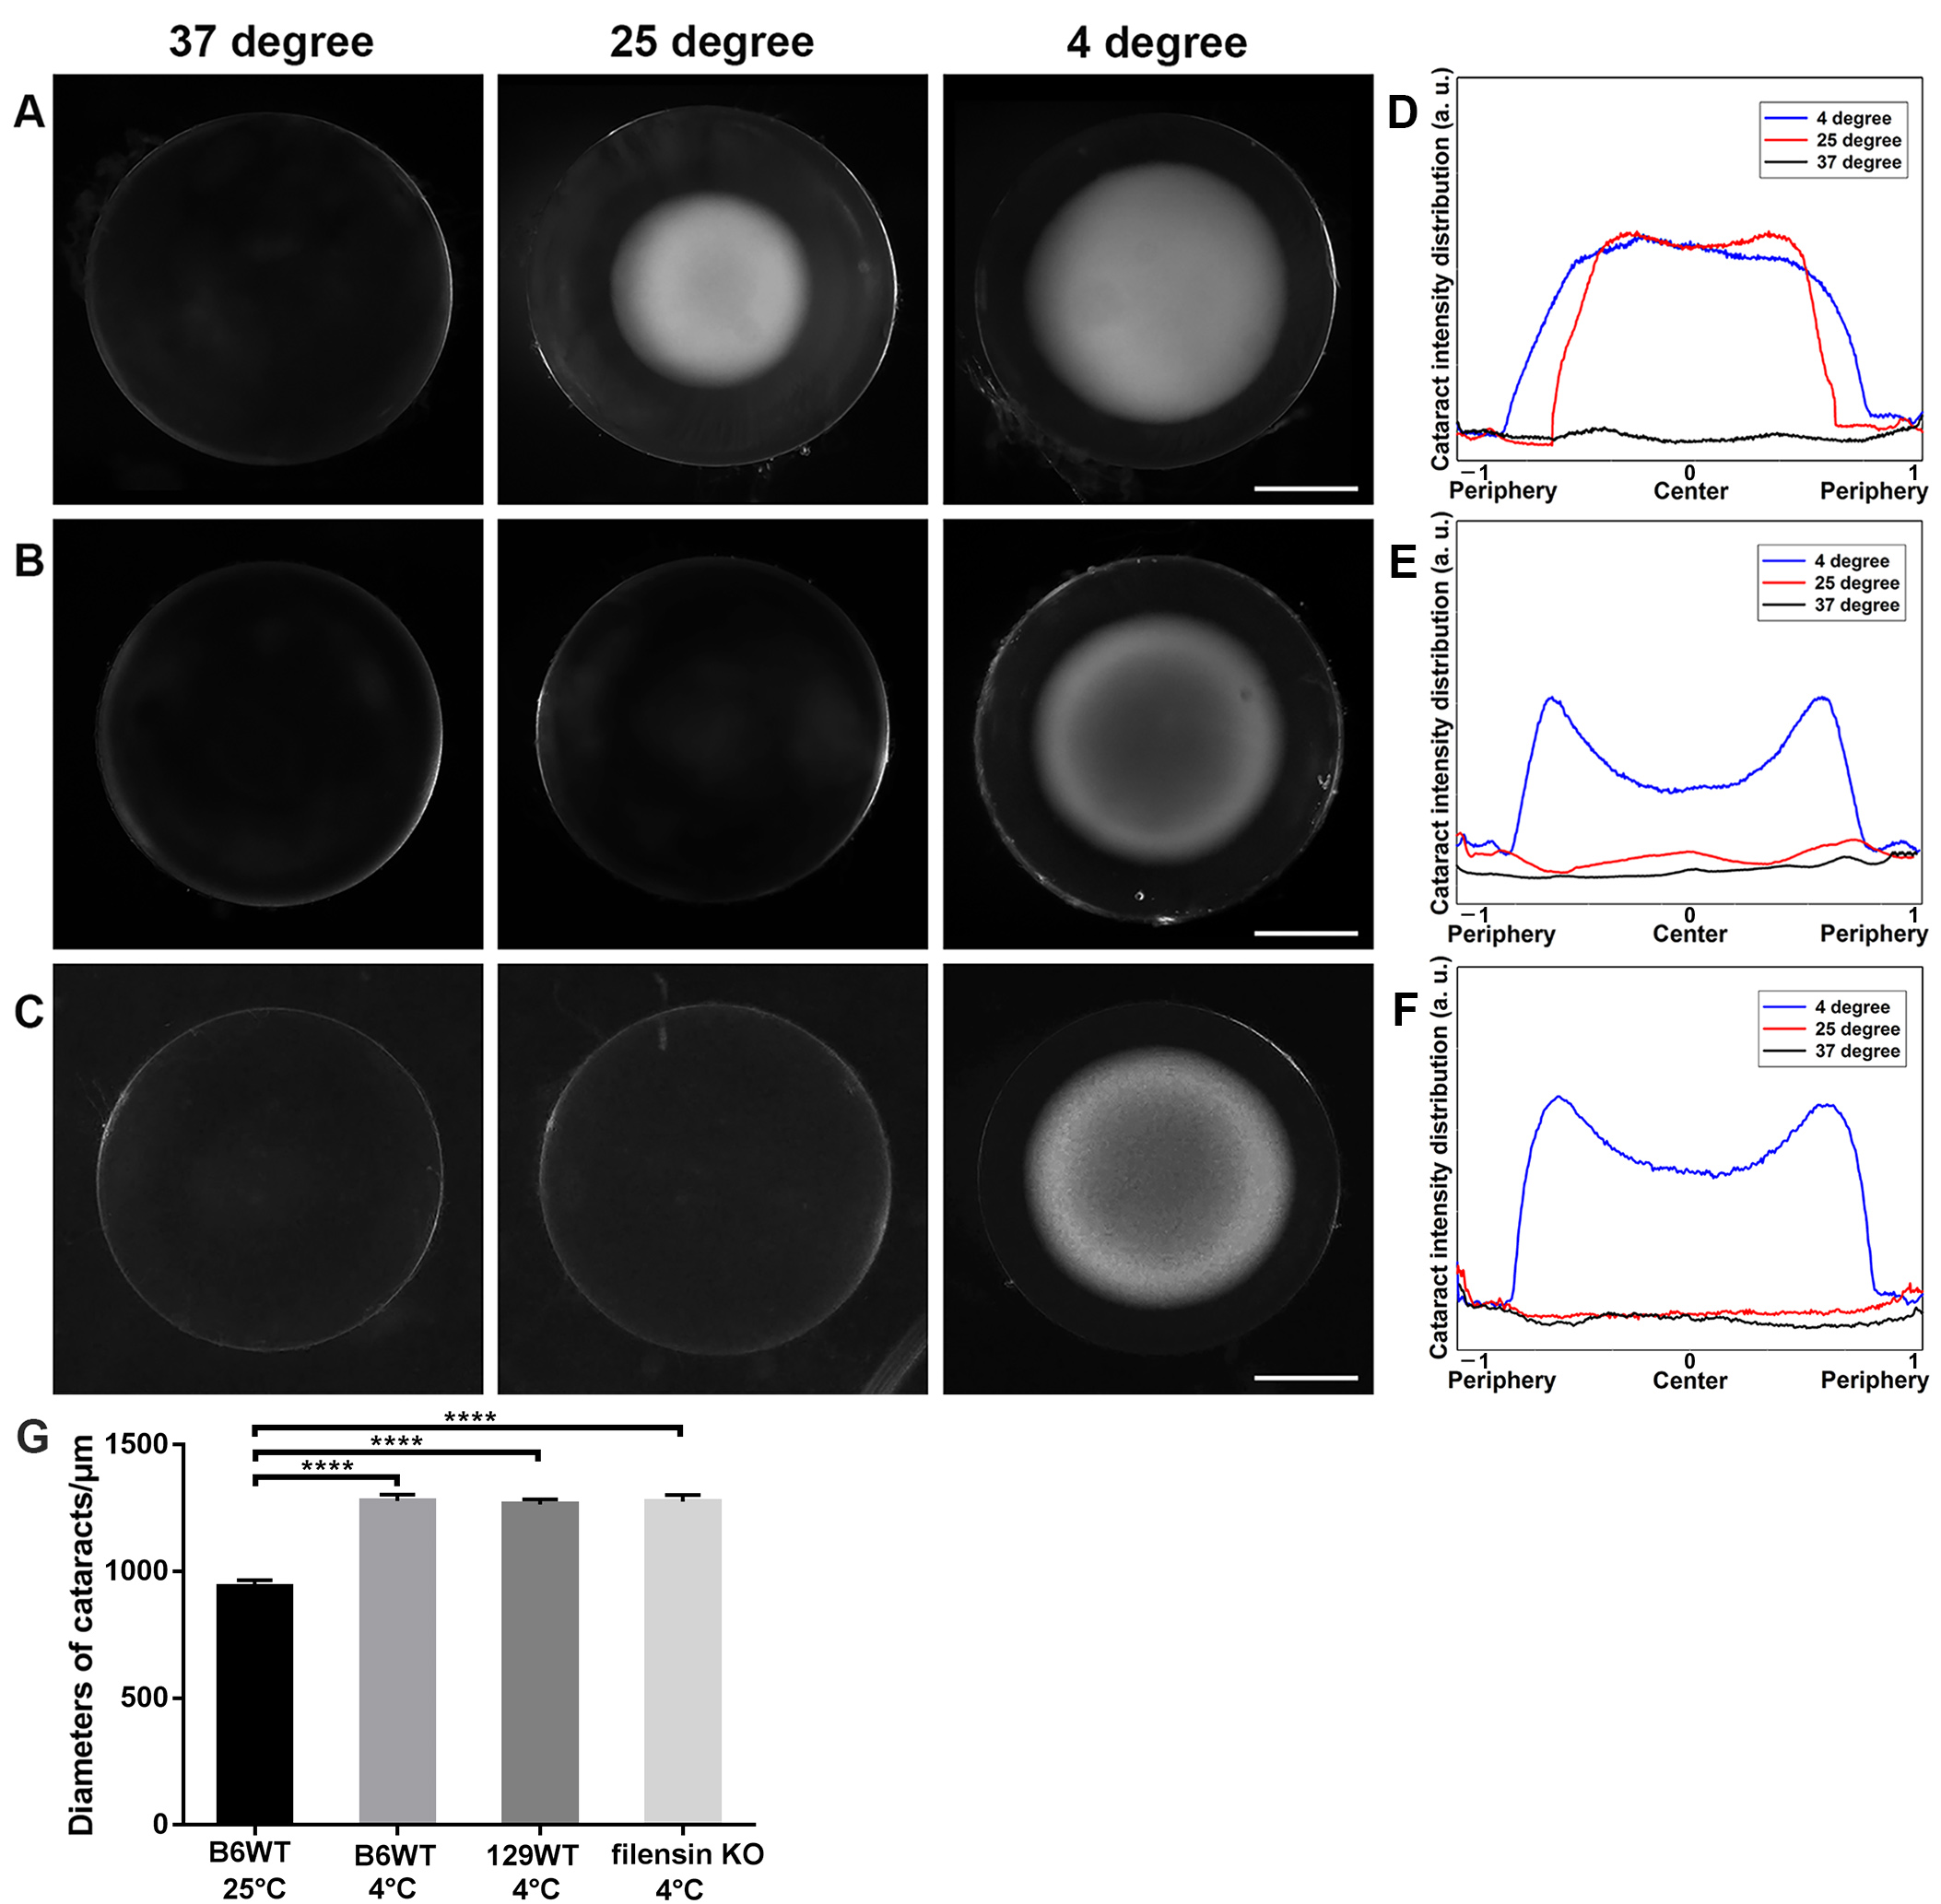
 Figure 1 of
Li, Mol Vis 2020; 26:603-612.
Figure 1 of
Li, Mol Vis 2020; 26:603-612.