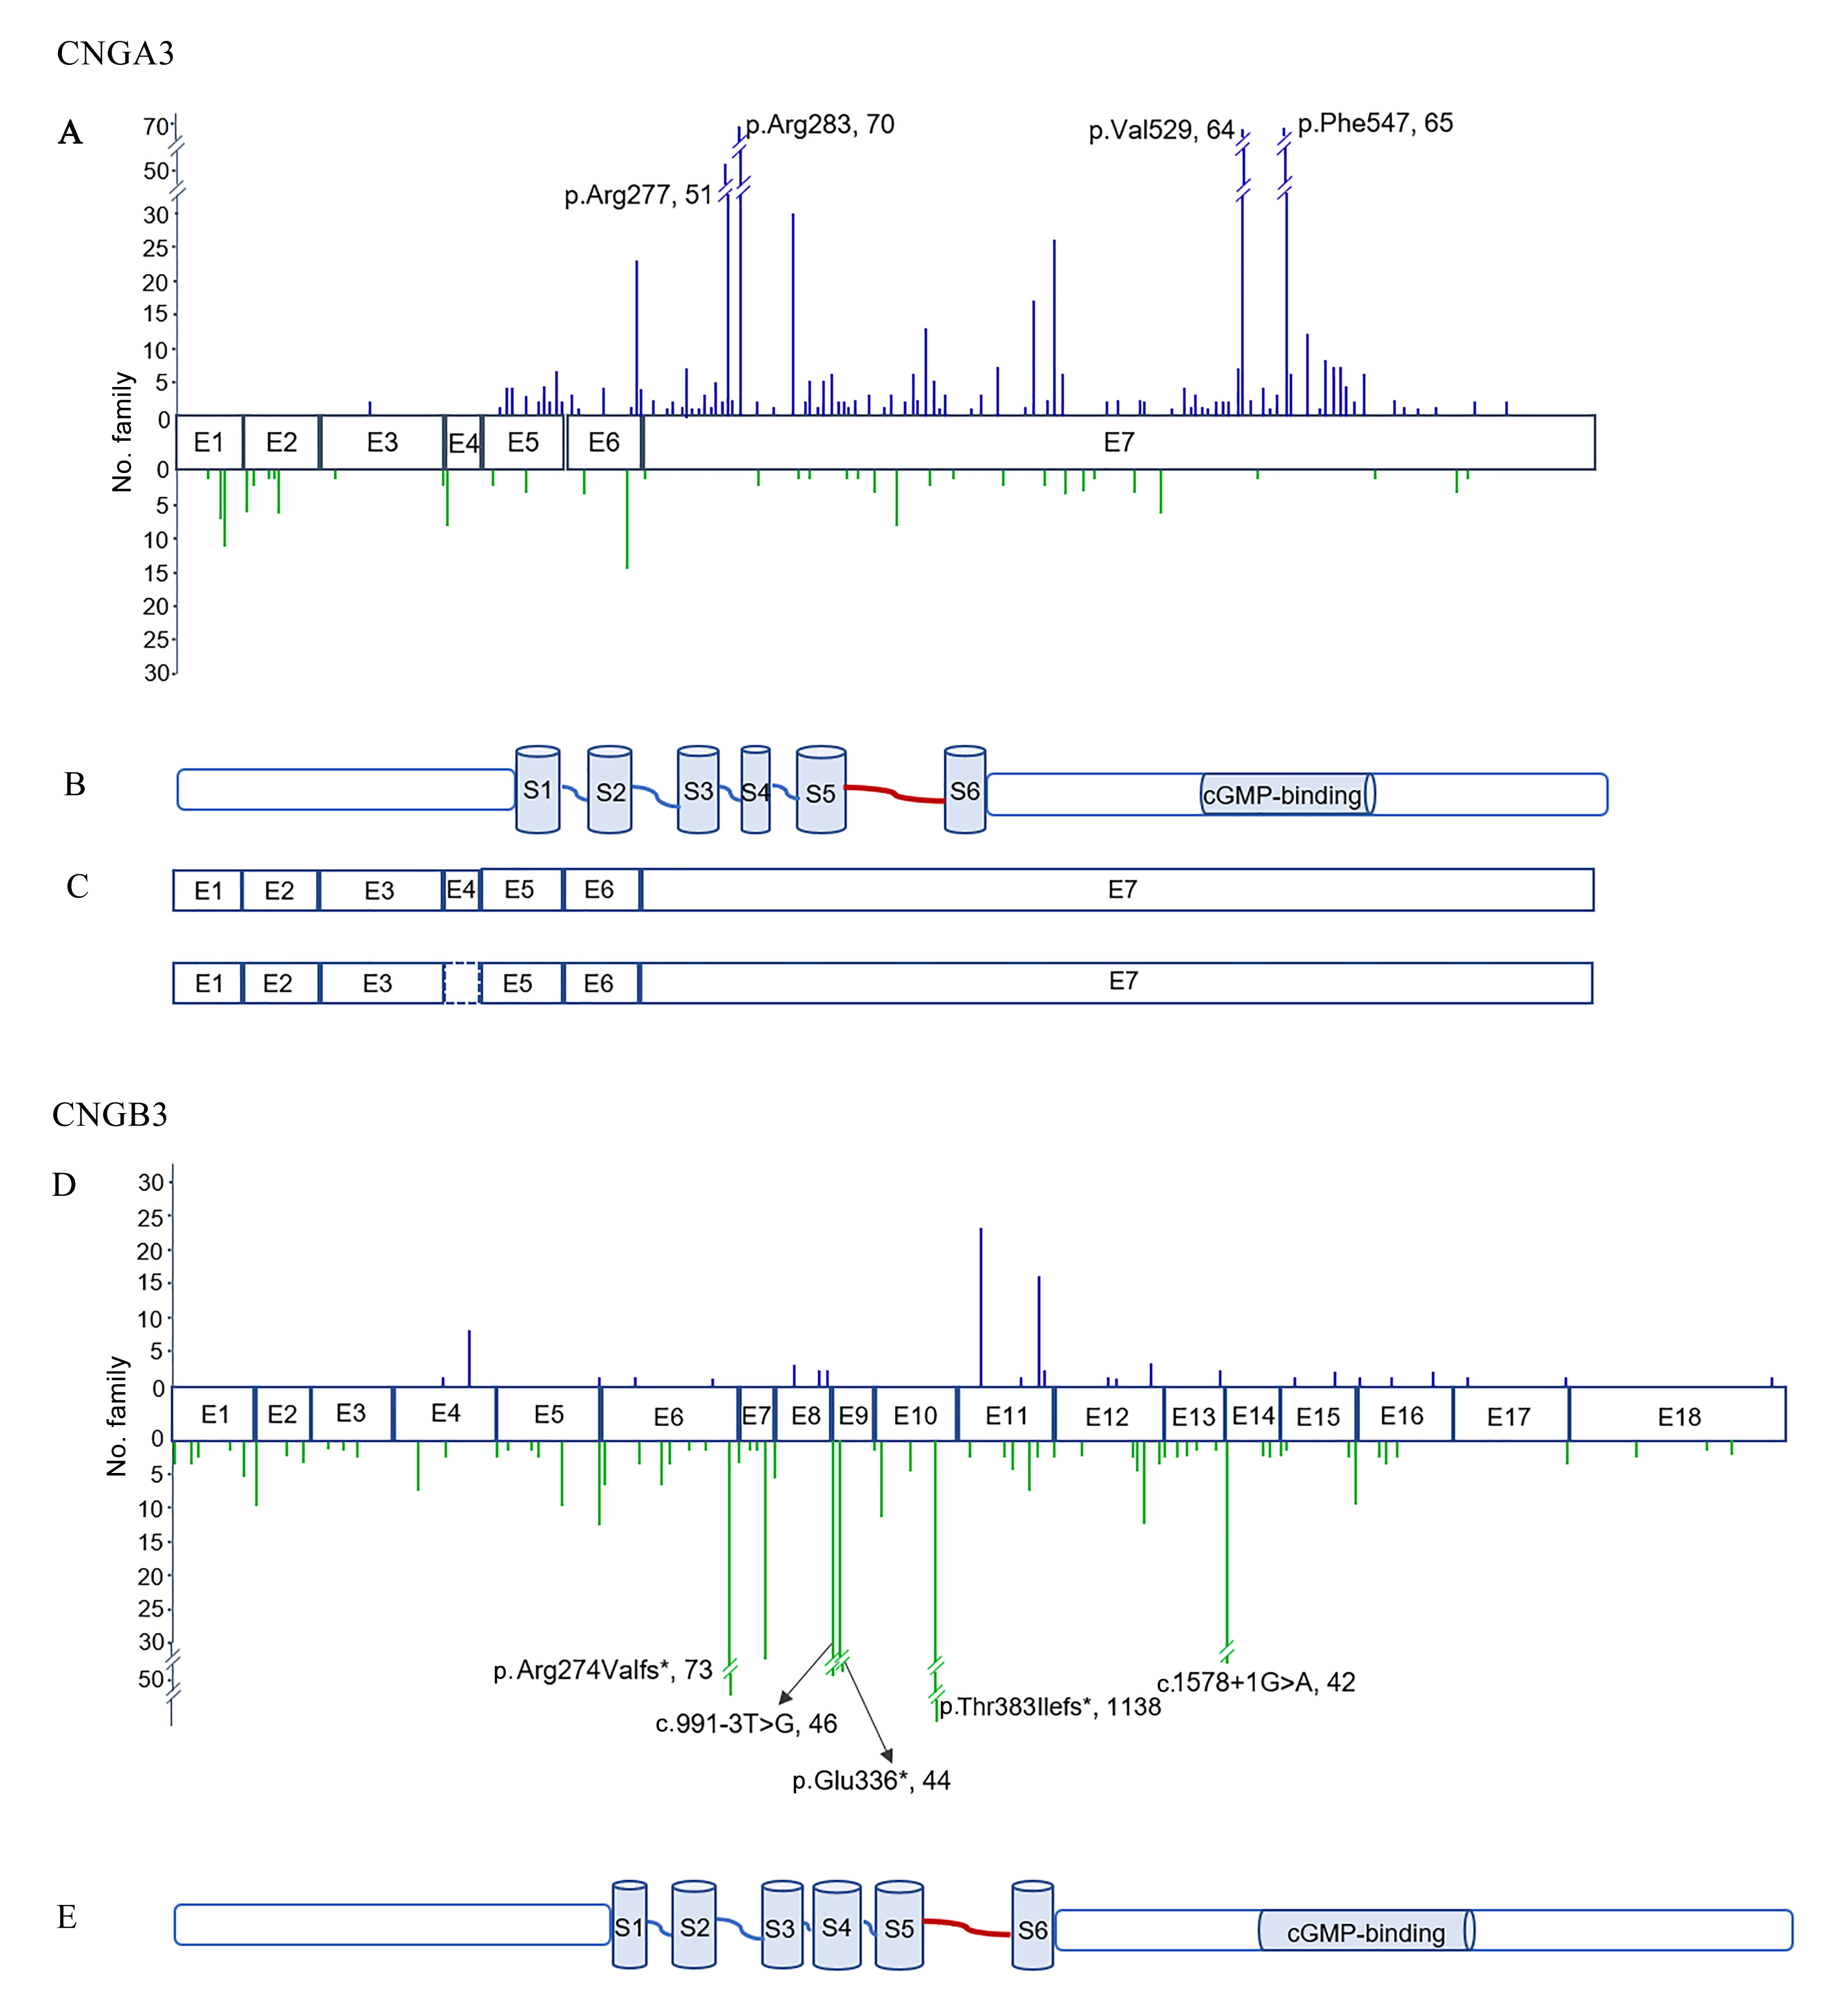
Figure 3. Variant locations in
CNGA3 and
CNGB3. The blue bar above and the green bar below represent the missense and truncation variants, respectively. B and E represent
the functional domains of
CNGA3 and
CNGB3, respectively. C represents the two alternative transcripts of
CNGA3. The
NM_001298.2 transcript above is longer than the
NM_001079878.1 transcript, which lacks exon 4. S1–6, six transmembrane helix domains; E, exon. The vertical axis represents the number of
families.
 Figure 3 of
Sun, Mol Vis 2020; 26:588-602.
Figure 3 of
Sun, Mol Vis 2020; 26:588-602.