Figure 1. The available ERG data of newly recruited probands. The proband IDs and their genotypes are indicated to the left. The electroretinogram
(ERG) recordings from the probands all show severely reduced or even extinguished cone responses with different rod responses.
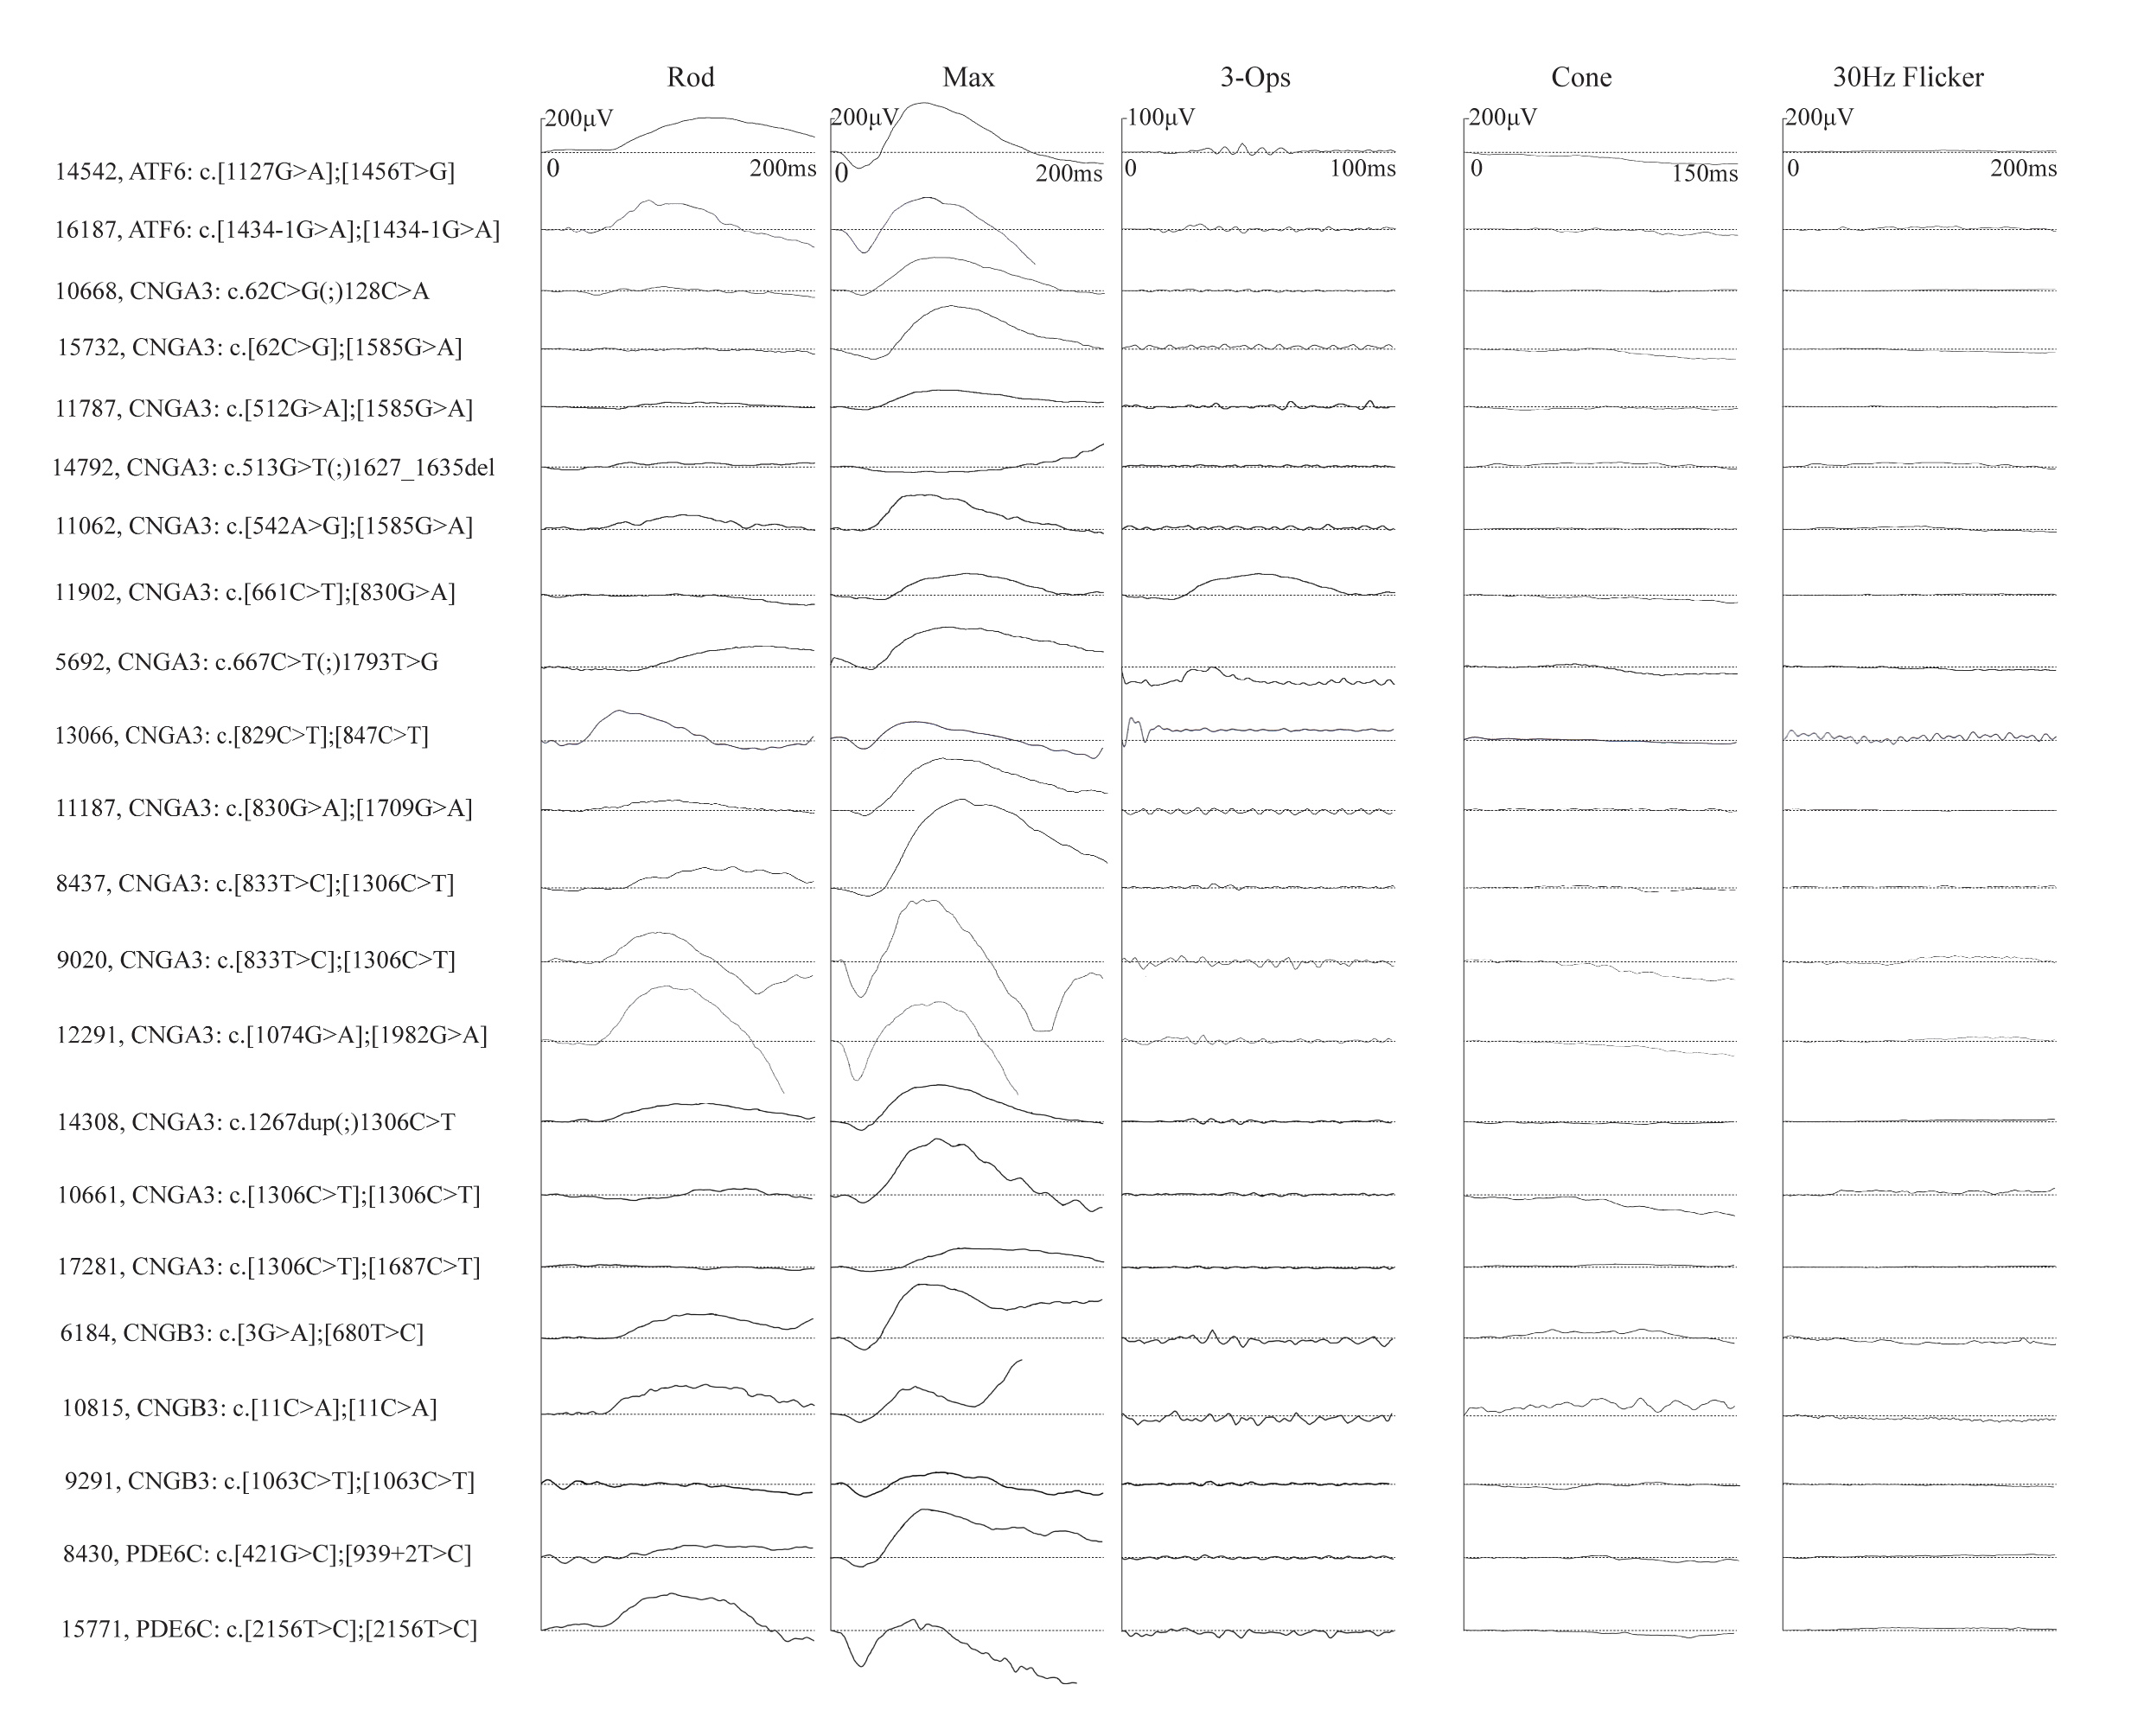
 Figure 1 of
Sun, Mol Vis 2020; 26:588-602.
Figure 1 of
Sun, Mol Vis 2020; 26:588-602.