Figure 1. Temporal pattern of MT1 mRNA expression and cellular distribution of the MT1 receptor (in ciliary processes of C57BL/6J versus DBA/2J mice). A: Total RNA from ciliary processes of either control (C57BL/6J) or glaucomatous (DBA/2J) animals of 3, 6, 9, or 12 months
of age was extracted, and MT1 mRNA was quantified with quantitative real-time PCR (qPCR) as described in the Methods section. Glyceraldehyde-3-phosphate
dehydrogenase (GAPDH) was used as a control for the differences in the cDNA input. Results are the mean ± standard error of
the mean (SEM) of 24 animals of each strain (*p<0.05, **p<0.01 versus the same mouse strain; #p<0.05, ###p<0.001 versus a different mouse strain; one-way analysis of variance (ANOVA) with Dunnett’s multiple comparisons test). B: Immunofluorescence images of ciliary processes from 3-month-old C57BL/6J (I), 3-month-old DBA/2J (II), and 12-month-old
DBA/2J (III) mice labeled with antibodies against the MT1 receptor (green). Nuclei were counterstained with propidium iodide (red). Phase-contrast and confocal images show that the
MT1 receptor is mainly located in the non-pigmented epithelium of the ciliary processes, and expression of the receptor is increased
in the DBA/2J versus C57BL/6J mice at the age of 3 months. Scale bar = 20 μm.
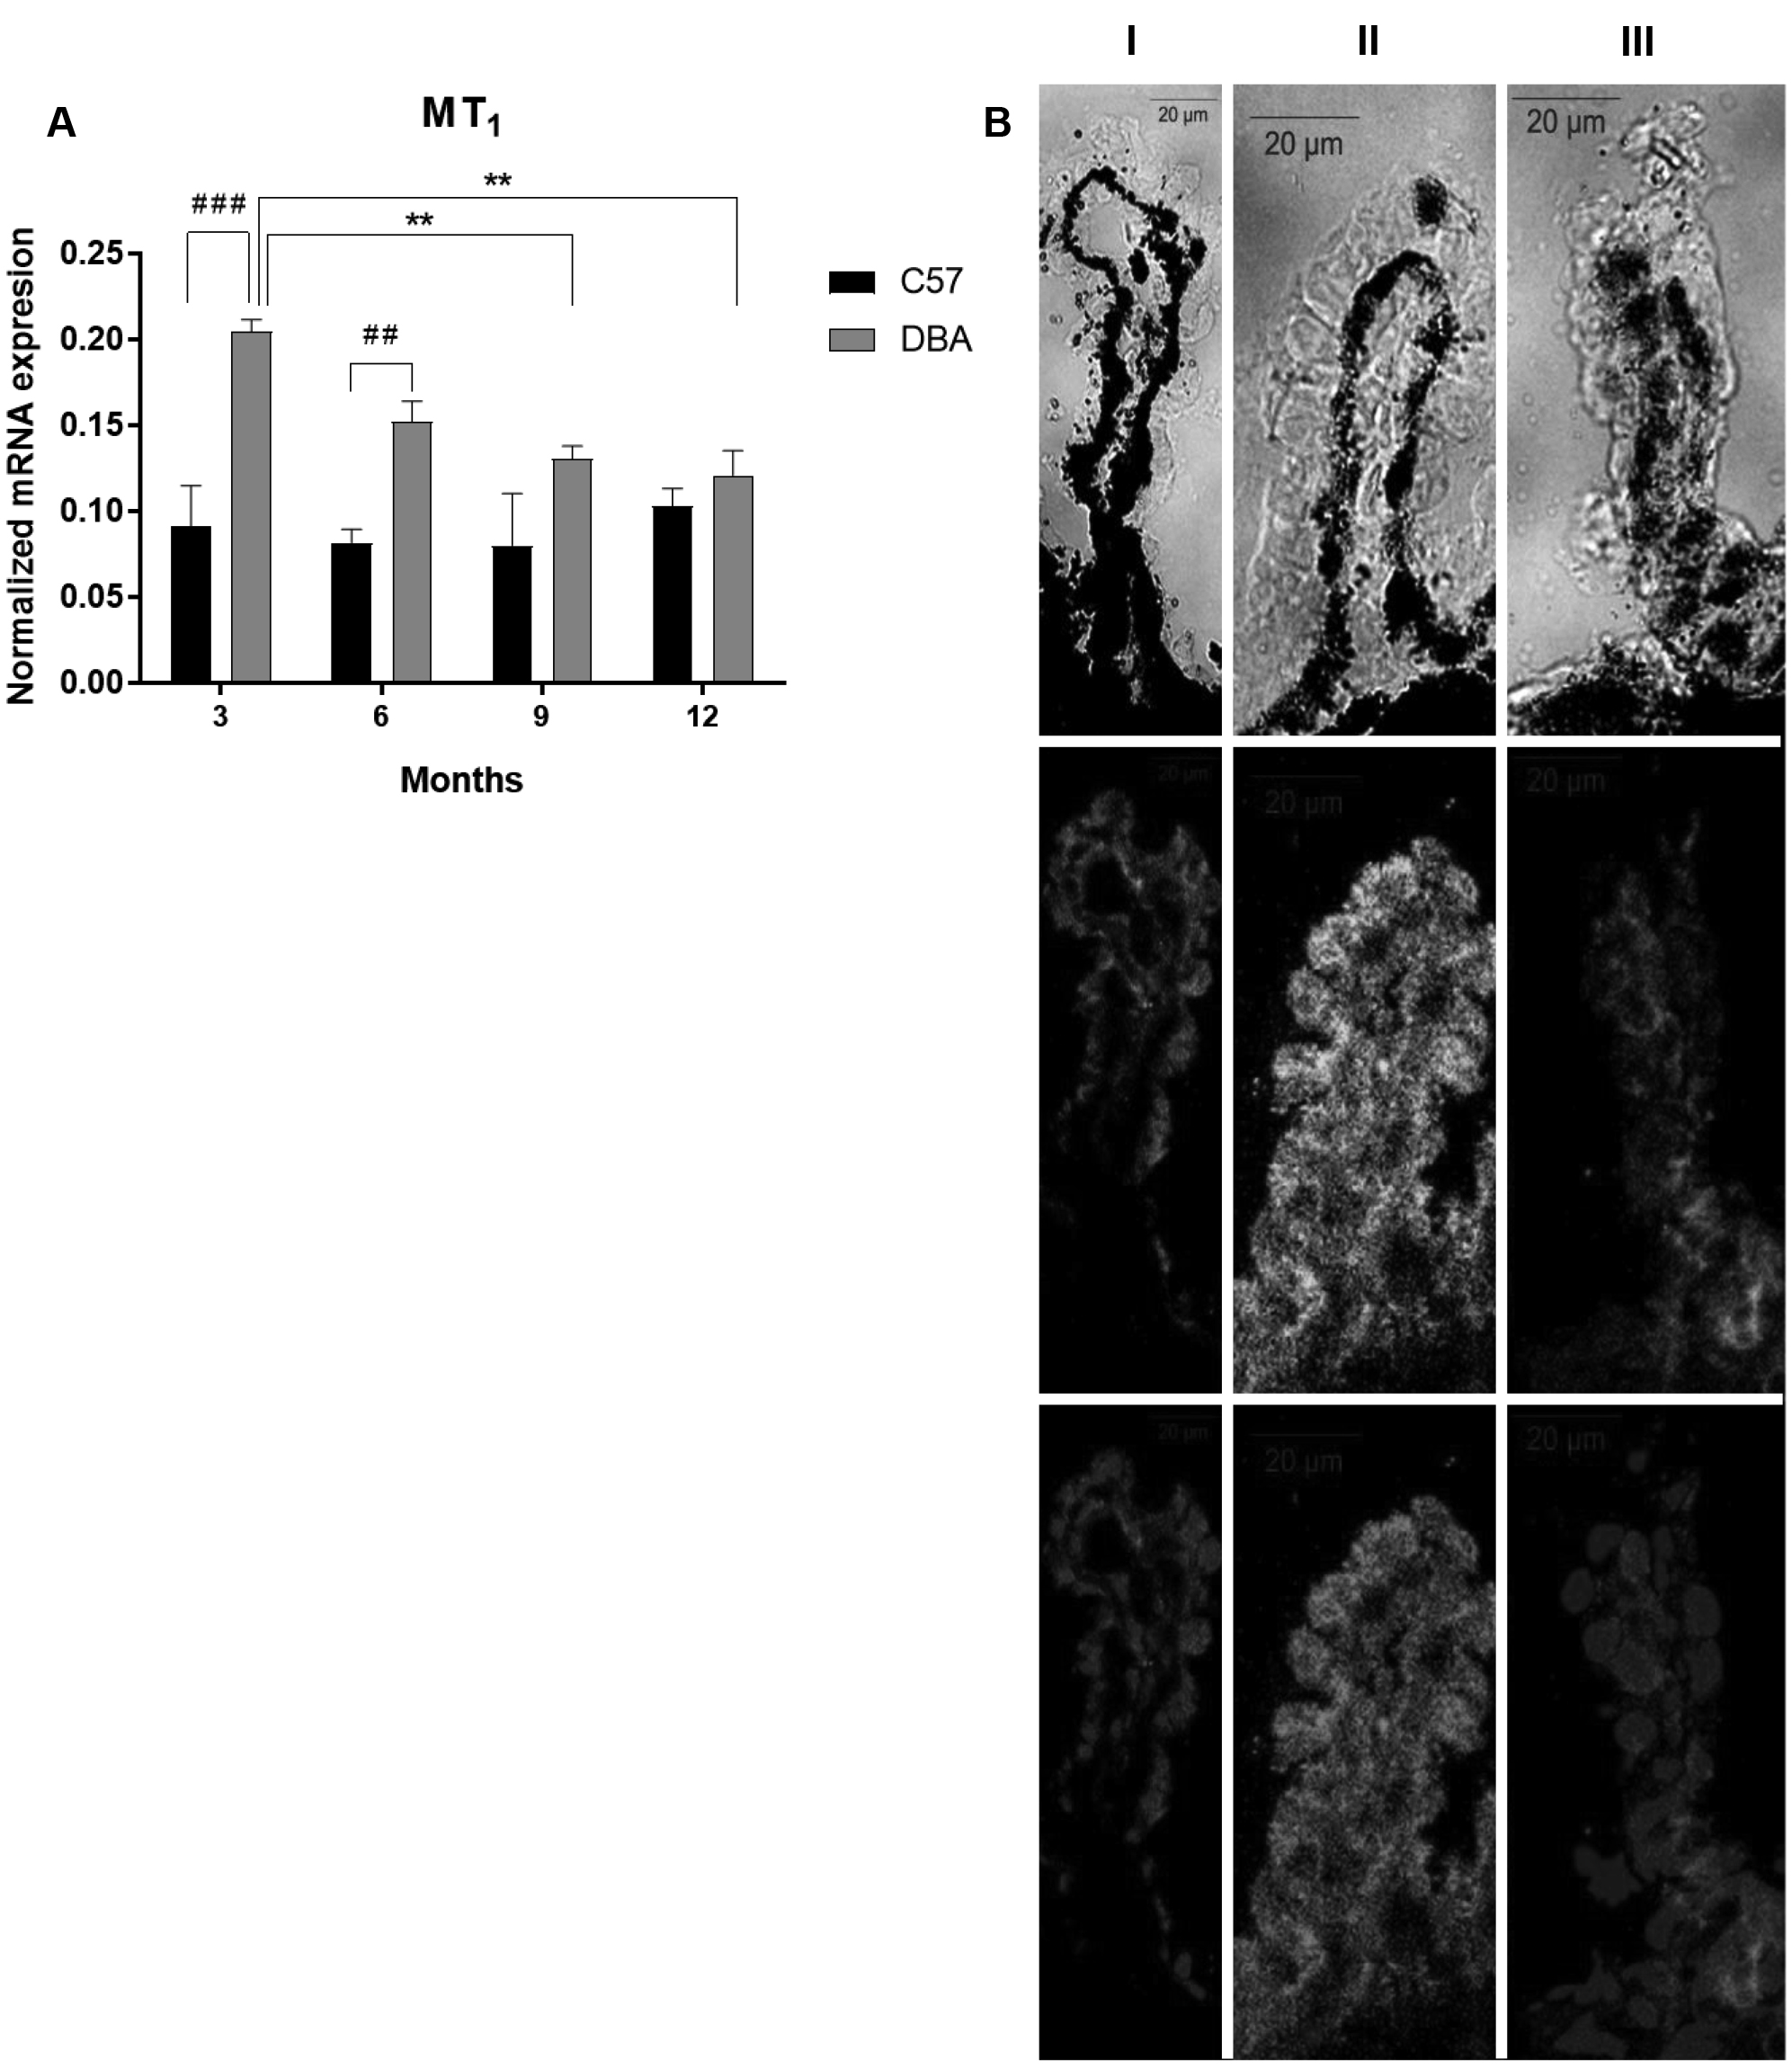
 Figure 1 of
Martínez-Águila, Mol Vis 2020; 26:530-539.
Figure 1 of
Martínez-Águila, Mol Vis 2020; 26:530-539.