Figure 3. Altered retinal sections and thicknesses of mice treated with NaIO3 or NaIO3 + TMP at three time points. A: hematoxylin and eosin (H&E) staining of paraffin-embedded retinal cross sections of mice treated with NaIO3 or NaIO3 + TMP at three time points. Top, middle, and bottom: Three groups at day 3, 7, and 14 after the NaIO3 administration. Left to right: The control group, the NaIO3-degenerated group (Group I), and the tetramethylpyrazine (TMP) group. Green arrows mark ONLs in Group I and the TMP group
were wave-like, and yellow arrows mark swelling and bundling of RPE cells migrated into the IS/OS after NaIO3 administration. GCL, ganglion cell layer; IPL, inner plexiform layer; INL, inner nuclear layer; OPL, outer plexiform layer;
ONL, outer nuclear layer; IS/OS, inner and outer segments. Scale bar: 50 um. B: Central retinal thicknesses of three groups at day 3, 7, and 14 were measured on histological sections. Asterisks indicate
the statistically significant deviation of thickness between Group I and the TMP group. C: Central ONL thicknesses of three groups at day 3, 7, and 14 were measured on histological sections. Asterisks indicate the
statistically significant deviation of thicknesses between Group I and the TMP group. (n = 5 outcomes of every mouse, **p<0.01,
*p<0.05).
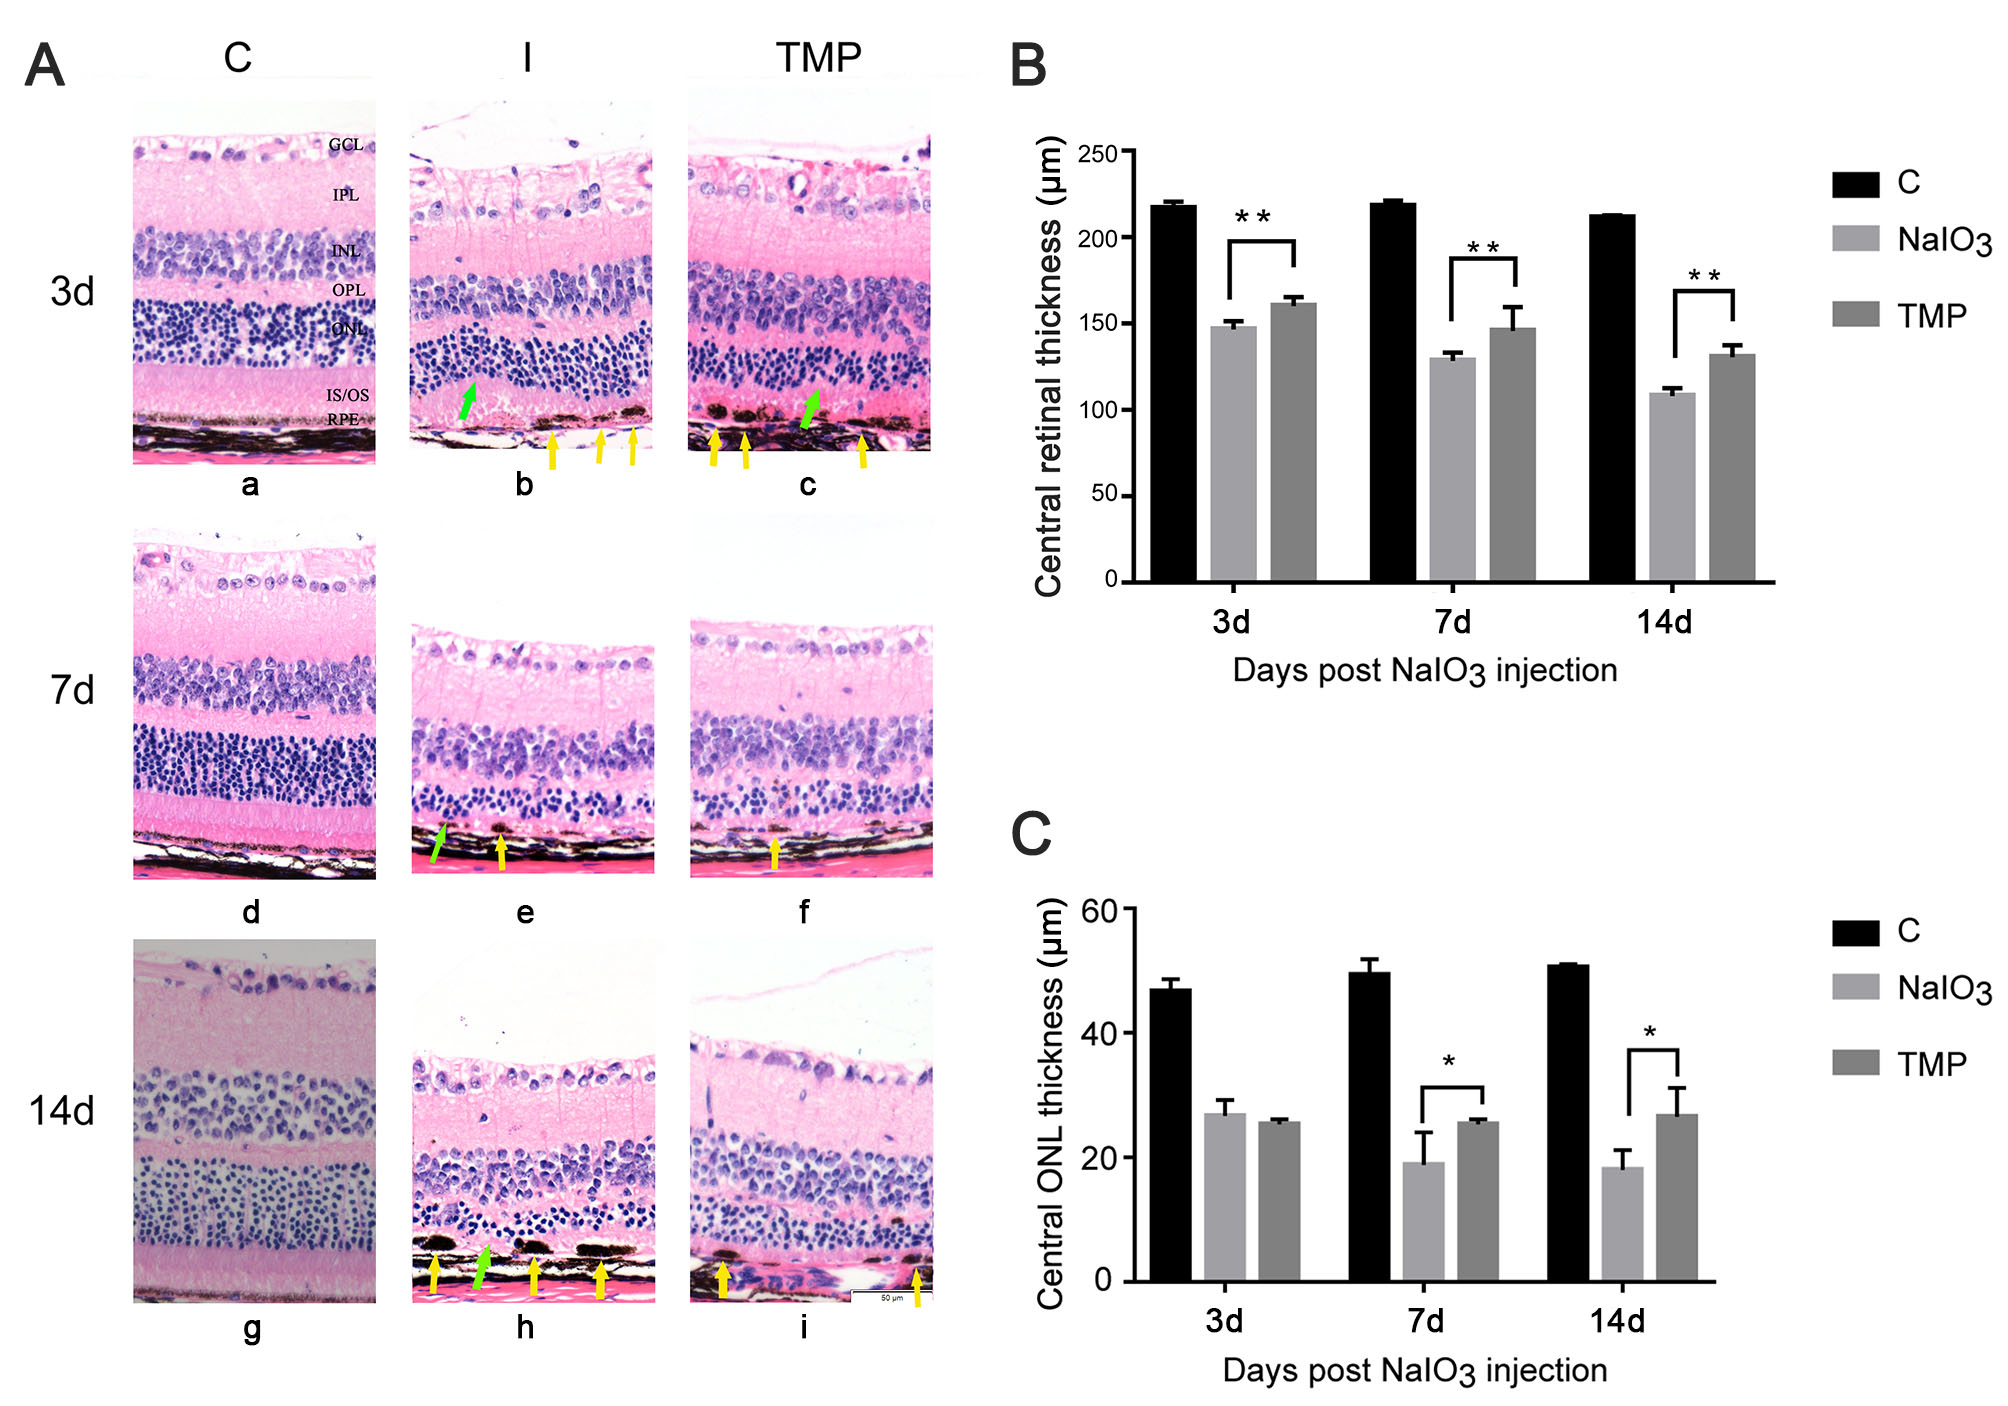
 Figure 3 of
Huang, Mol Vis 2020; 26:494-504.
Figure 3 of
Huang, Mol Vis 2020; 26:494-504.