Figure 2. OCT scans of mice treated with NaIO3 or NaIO3 + TMP at three time points. Top, middle, and bottom: The three groups at day 3, 7, and 14 after NaIO3 administration. Left to right: The control group, the NaIO3-degenerated group (Group I), and the tetramethylpyrazine (TMP) group. Yellow double-headed arrows mark the outer nuclear
layer (ONL) thickness. Red arrows mark the RPE migrated into the inner and outer segments (IS/OS).
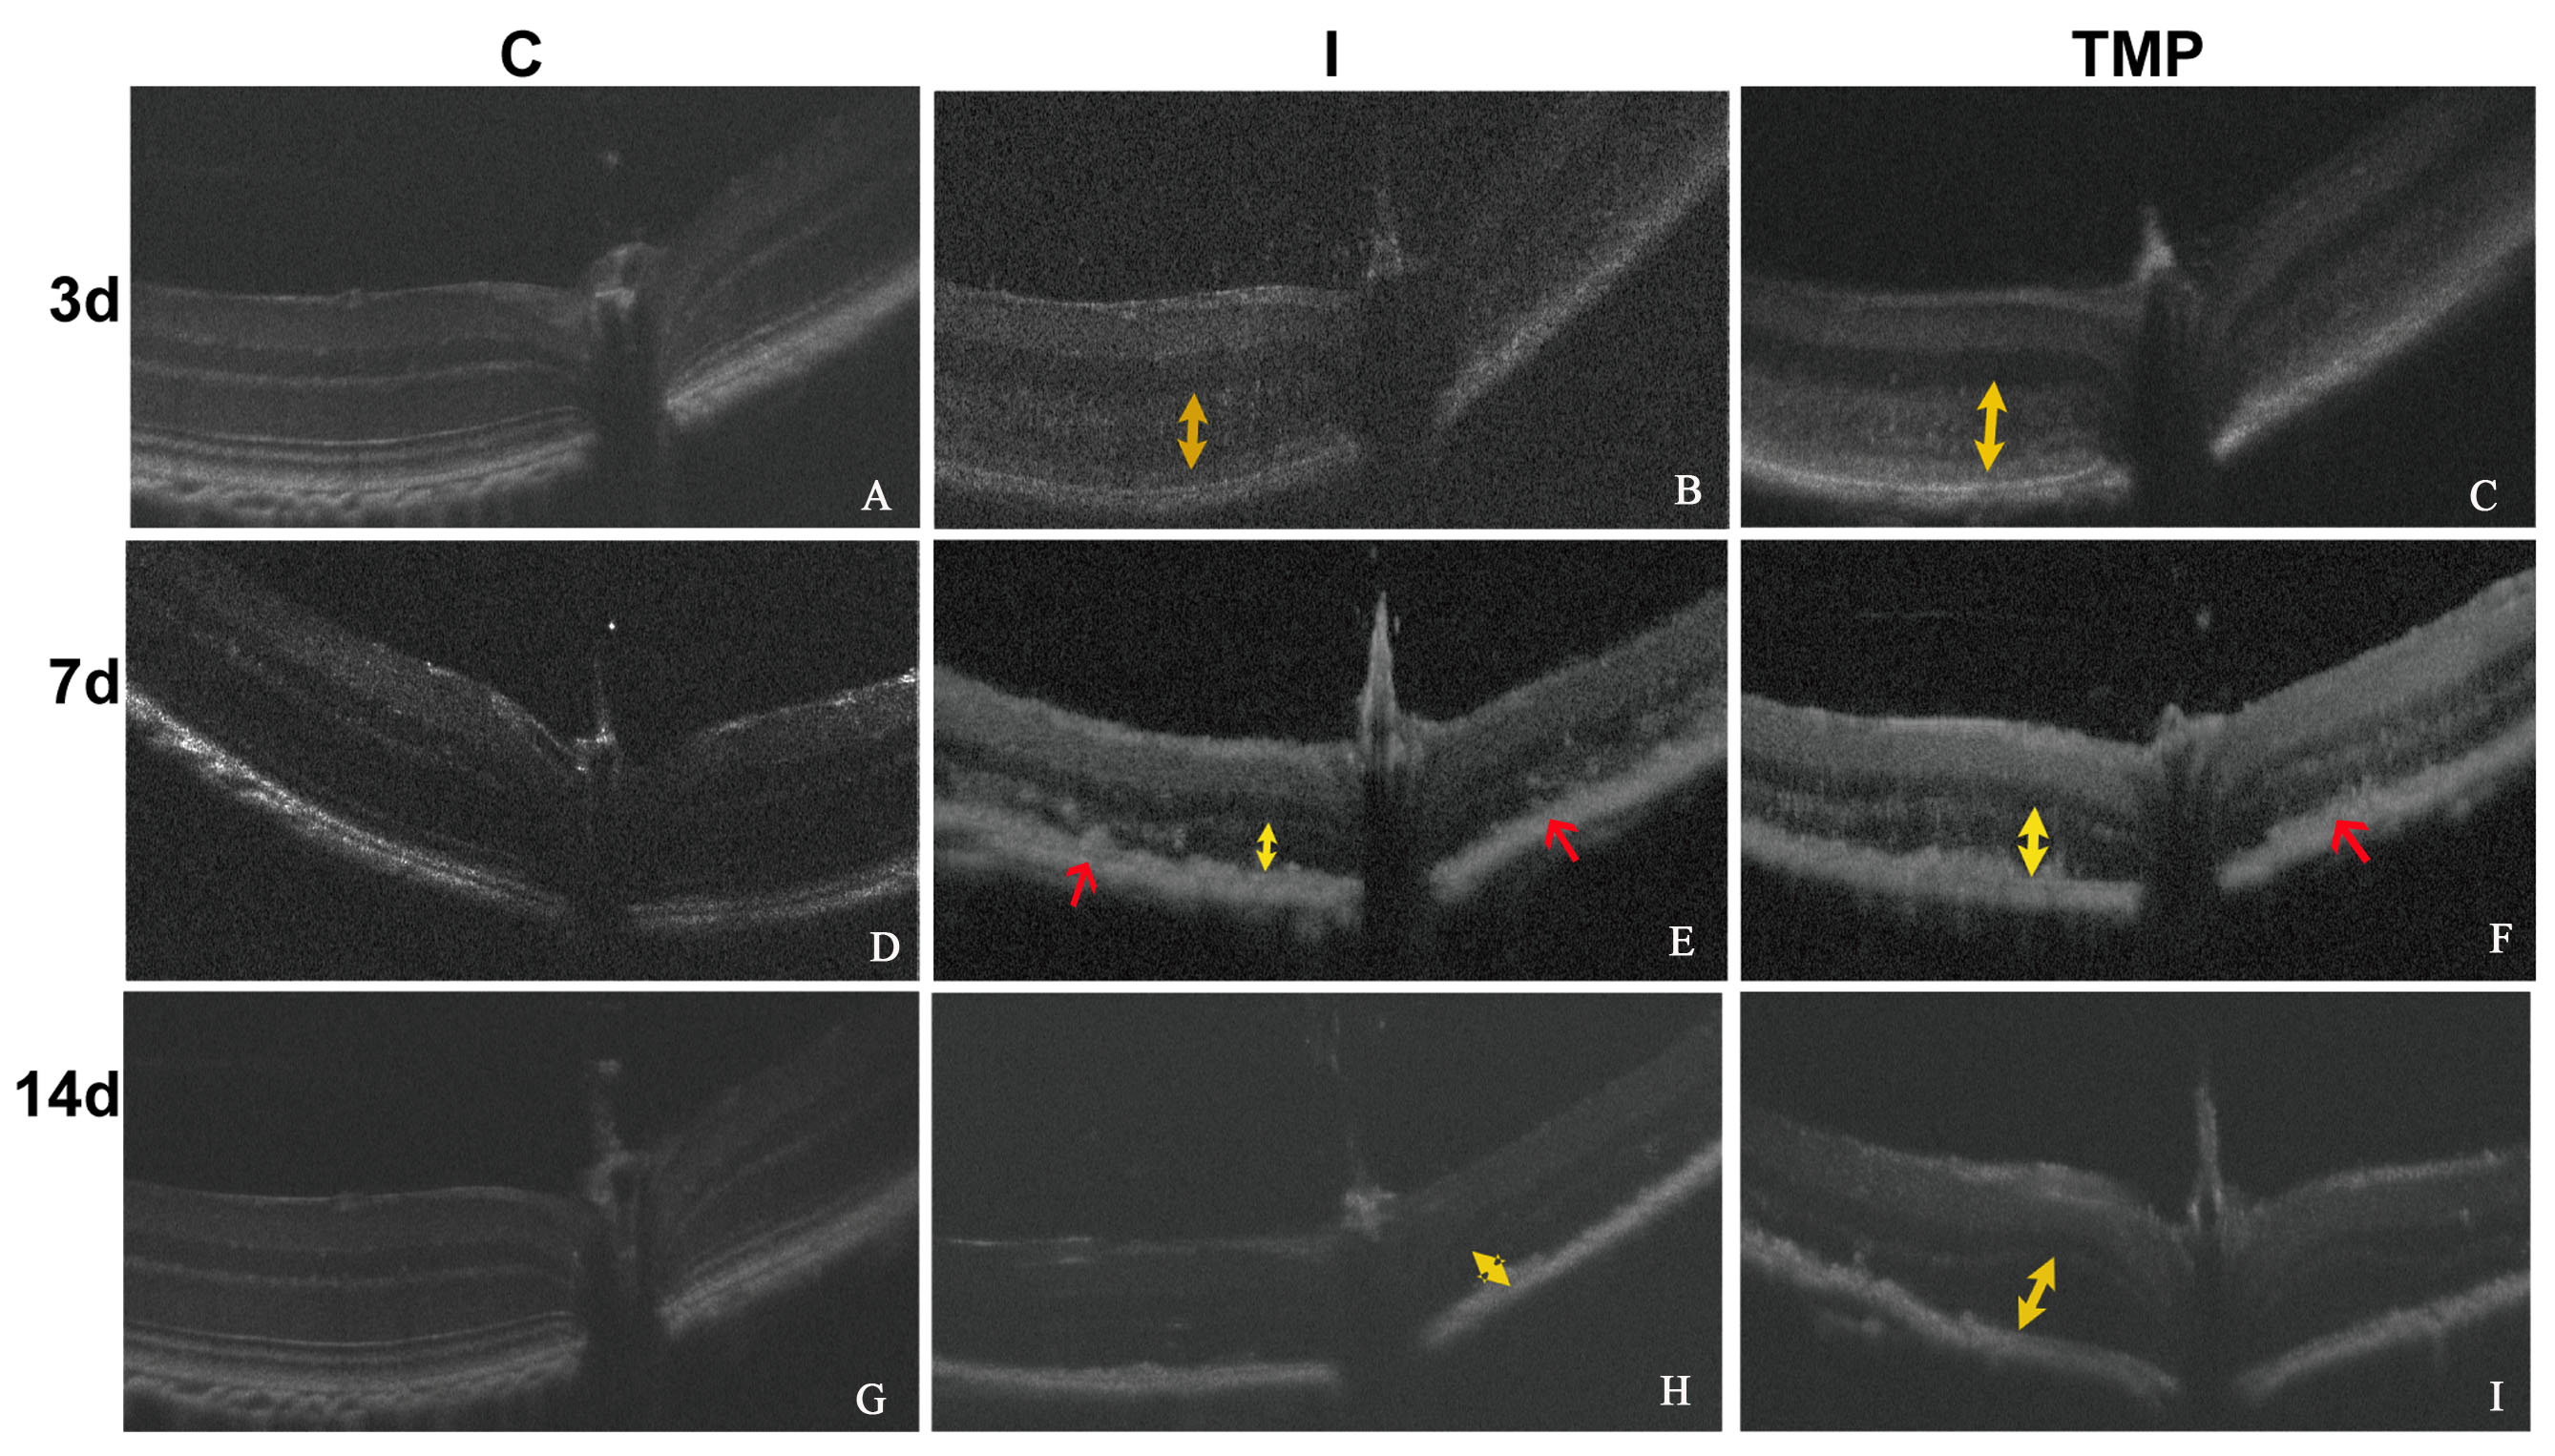
 Figure 2 of
Huang, Mol Vis 2020; 26:494-504.
Figure 2 of
Huang, Mol Vis 2020; 26:494-504.