Figure 2. Differential methylation in human primary cultured SC cells. A: Binomial distribution of the Schlemm’s canal (SC) β values. Two peaks were found near 0.1 and 0.9. B: A Manhattan plot of differential methylation changes in single sites. The red line represents the threshold of a p value
5E-8 while the blue line represents the threshold of a p value 1E-5. C: The heat map shows different methylation patterns in SC cells with or without glaucoma.
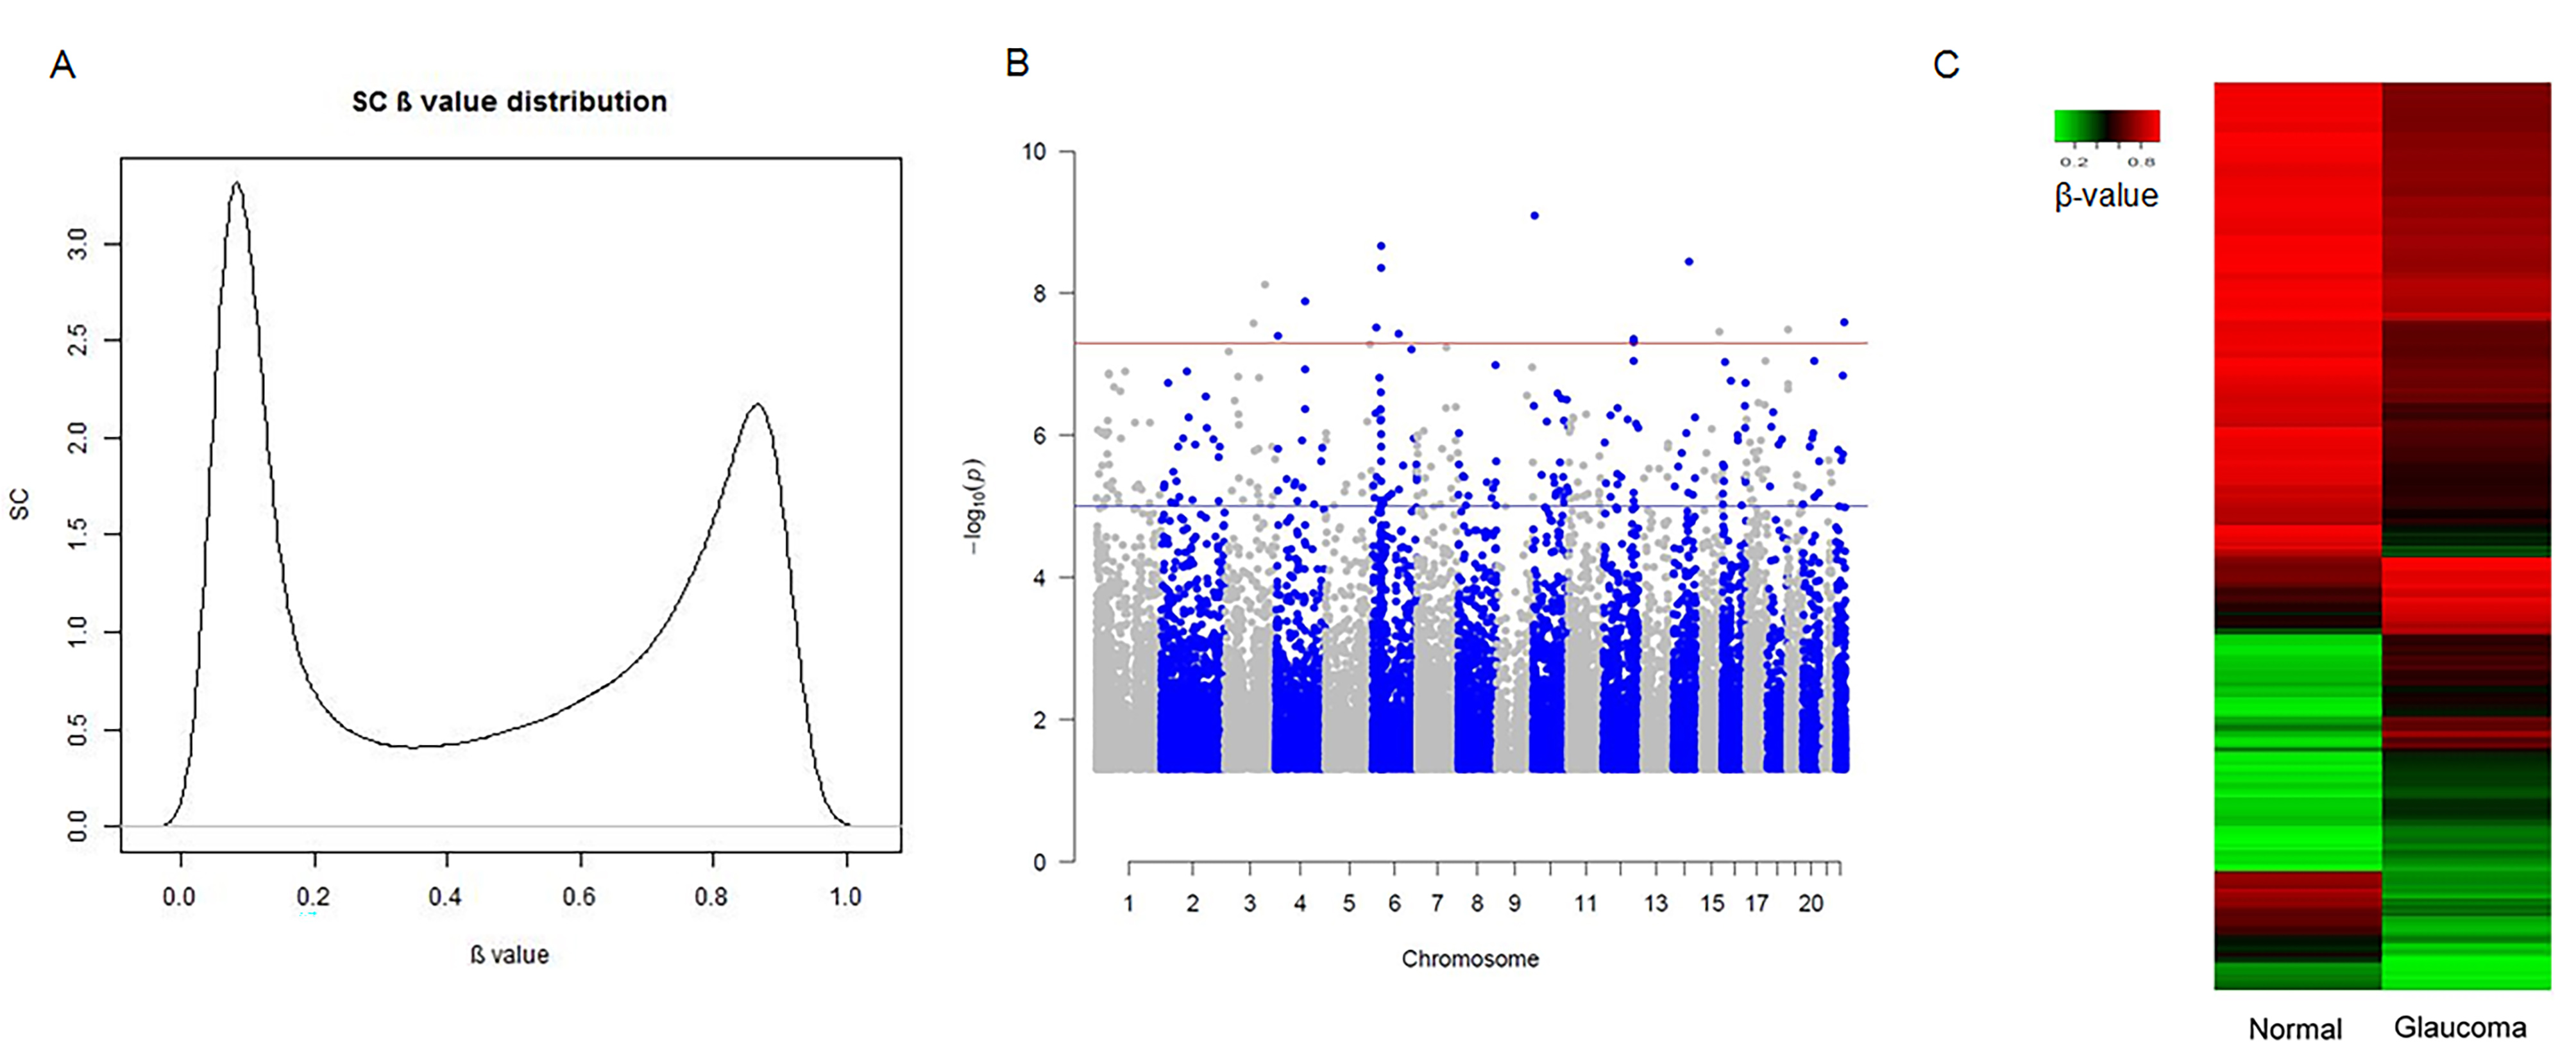
 Figure 2 of
Cai, Mol Vis 2020; 26:483-493.
Figure 2 of
Cai, Mol Vis 2020; 26:483-493.