Figure 1 of
Cai, Mol Vis 2020; 26:483-493.
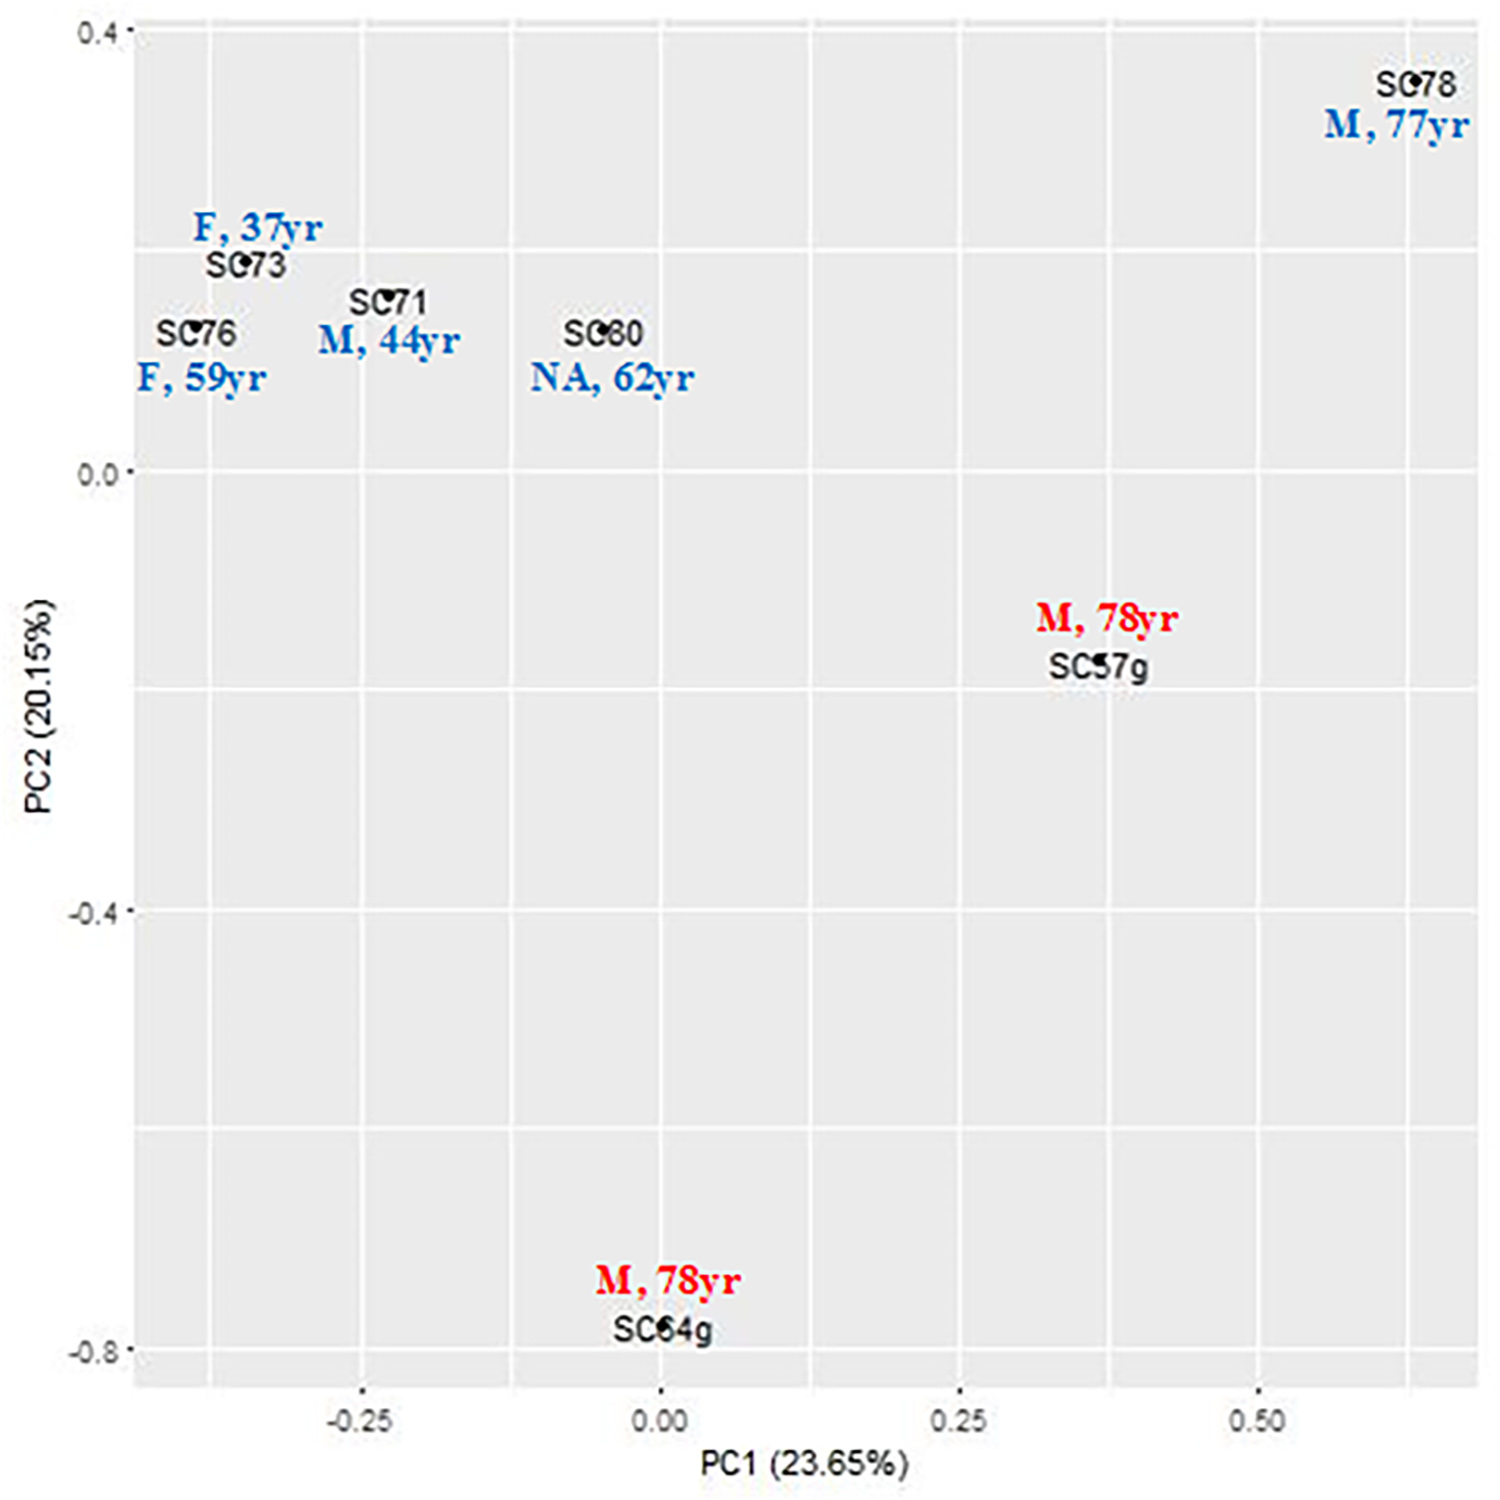
Figure 1.
Principal component analysis of SC cells using genome-wide methylation data. F: female. M: male. NA: no gender information. Blue: non-glaucoma control SC samples. Red: glaucomatous SC samples.
 Figure 1 of
Cai, Mol Vis 2020; 26:483-493. Figure 1 of
Cai, Mol Vis 2020; 26:483-493.
Figure 1 of
Cai, Mol Vis 2020; 26:483-493. Figure 1 of
Cai, Mol Vis 2020; 26:483-493.