Figure 6. Localization of Invivofectamine 3.0 transfection with Block-It siRNA. A: Whole, stitched images of the retina show a representation of the distribution of Block-It siRNA with only autofluorescence
of the outer segments in the negative control animals. B: Central images of the retina revealed no fluorescence in the negative siRNA-injected animals except autofluorescence of
the outer segments. Grey lines indicate the cellular layers. C: Animals injected with Block-It display a similar pattern of autofluorescence but also have fluorescence visible in the inner
and outer layers of the retina both peripherally and centrally. D: In the central retinal images, fluorescence can be seen throughout the ganglion cell layer (GCL), inner nuclear layer (INL),
and outer nuclear layer (ONL) of the retina. Whole cells being transfected can be seen throughout the sections (white arrowheads).
E: Quantification of fluorescence intensity revealed a statistically significant increase in animals injected with Block-It
siRNA when compared to those injected with negative siRNA. F: Densitometry measurements of the retinal layers revealed statistically significant increases in fluorescence in the GCL,
INL, and ONL in animals injected with Block-It (*p<0.05 using unpaired Student t test, n=4).
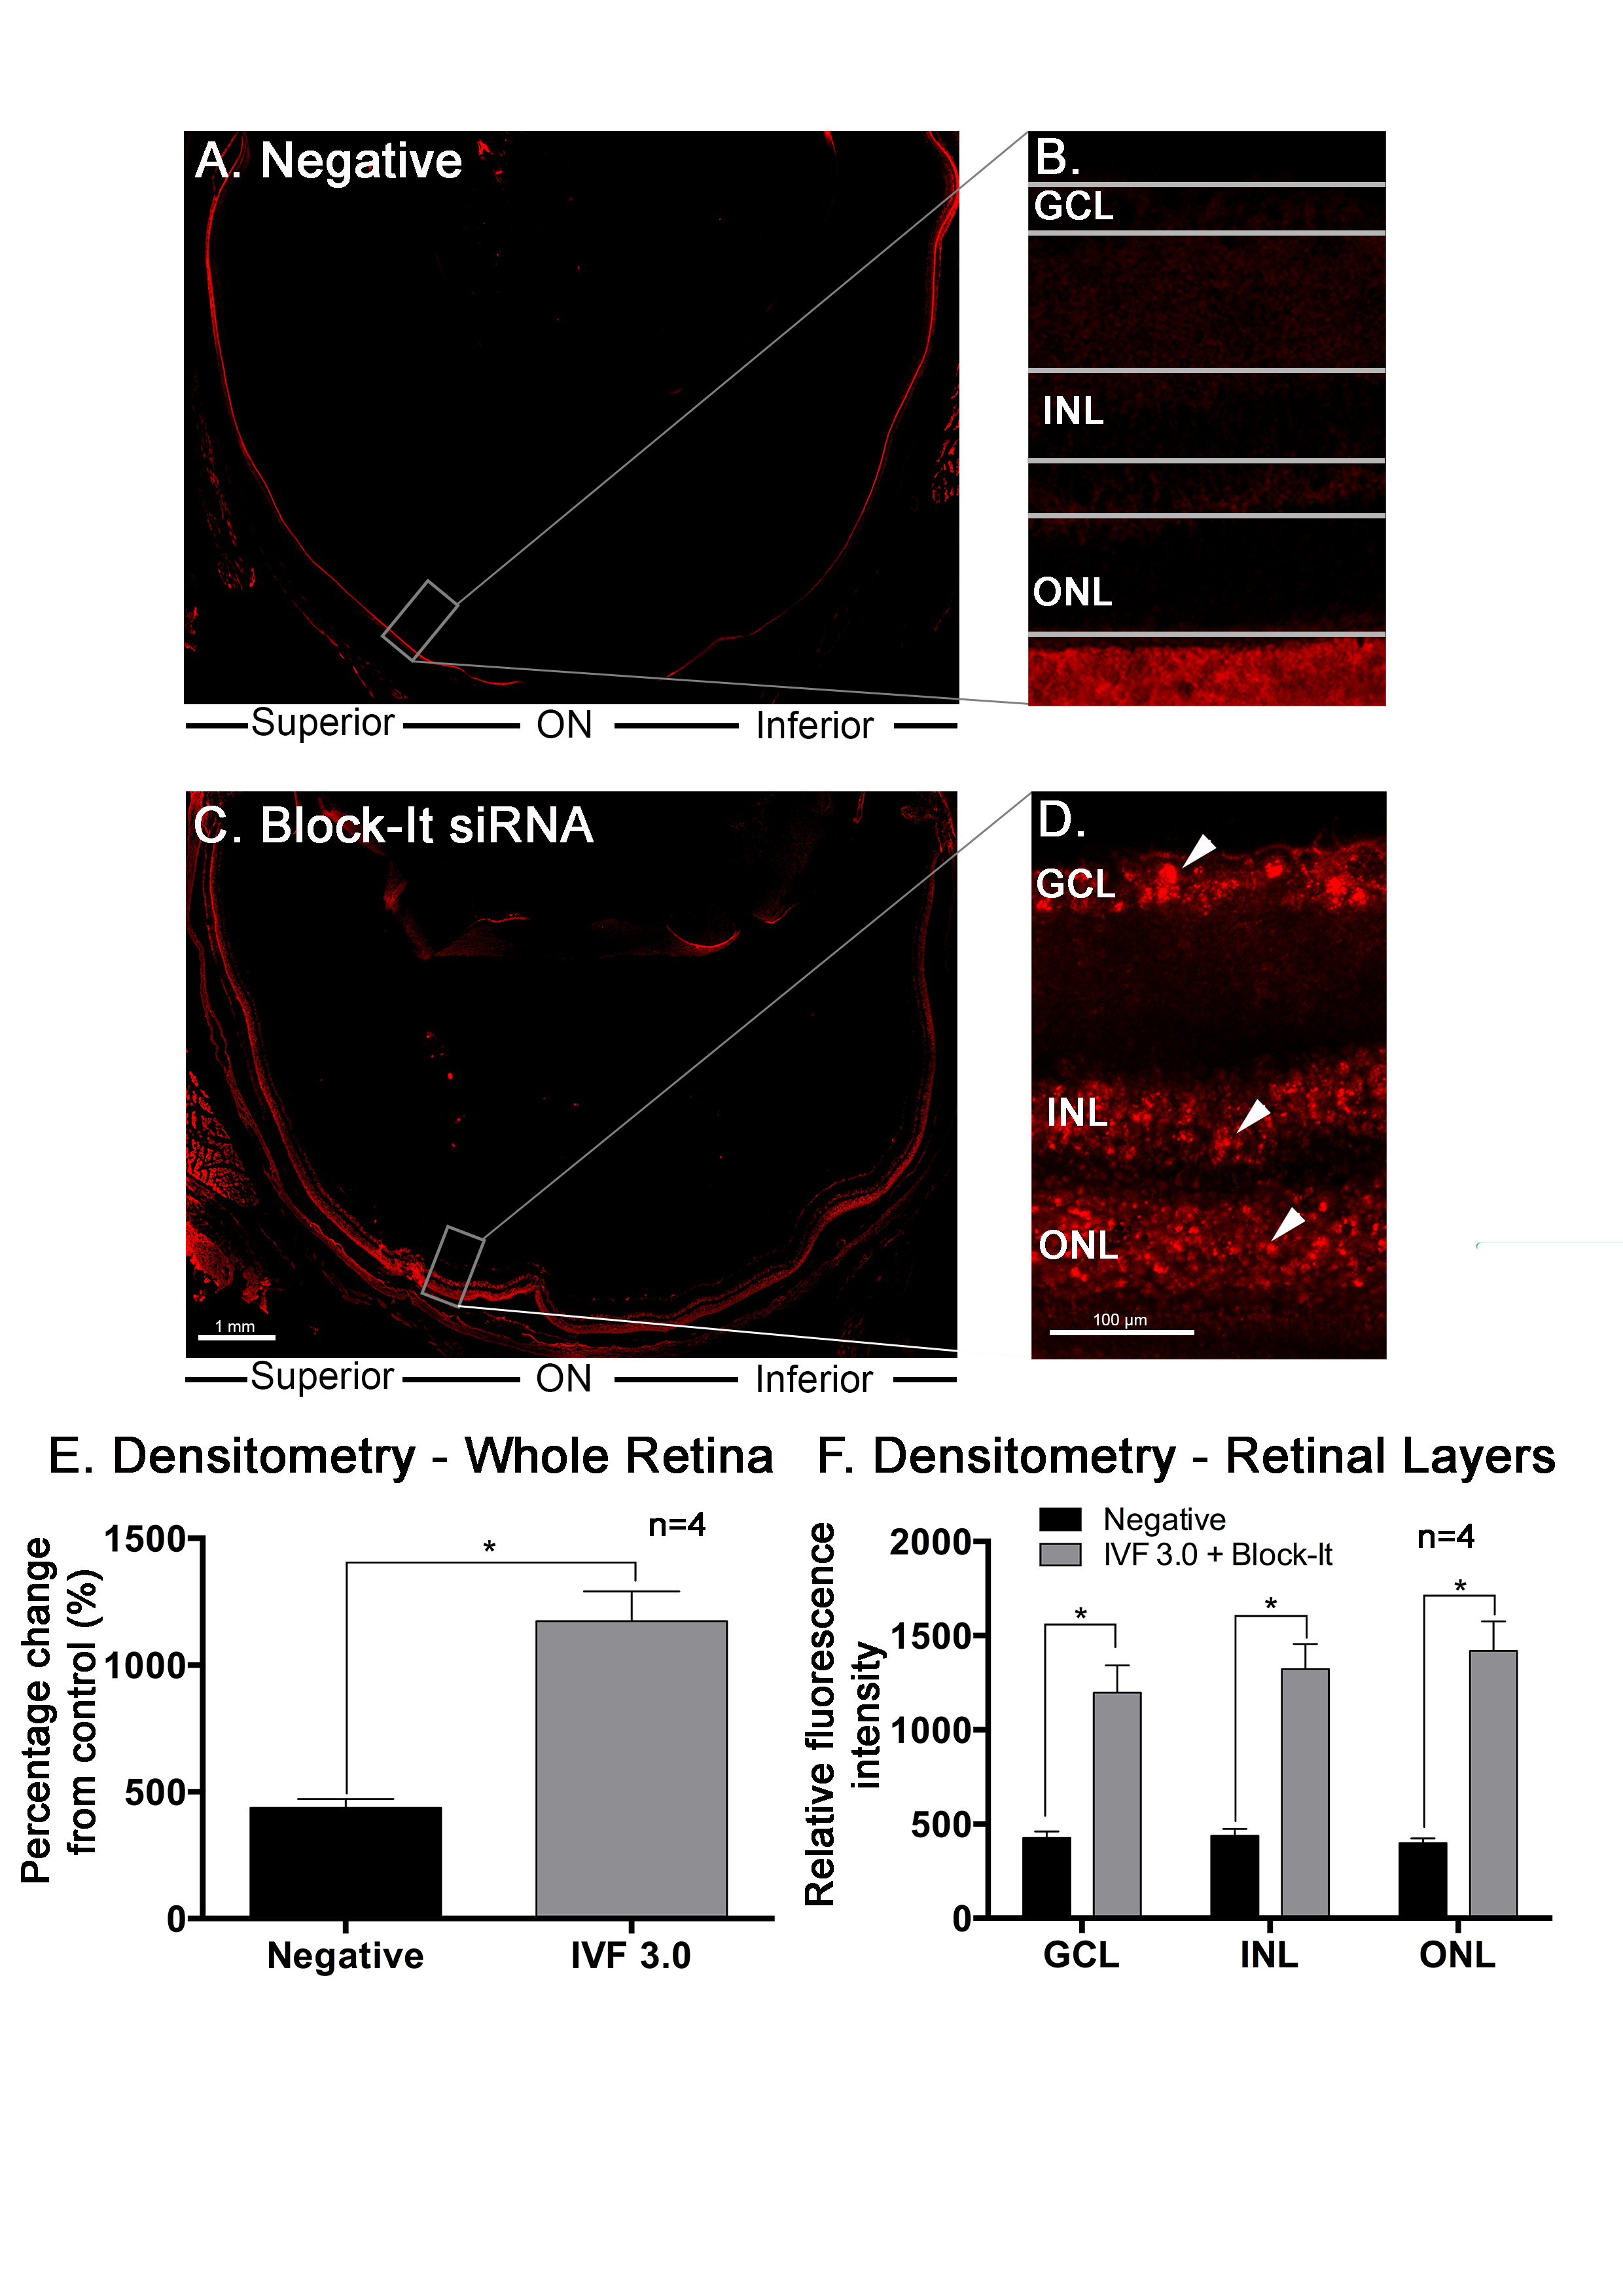
 Figure 6 of
Chu-Tan, Mol Vis 2020; 26:48-62.
Figure 6 of
Chu-Tan, Mol Vis 2020; 26:48-62.