Figure 4. ERG and OCT indicating retinal safety and health following Invivofectamine 3.0 injection. A–D: Representative images of retinal and fundus images taken from the PBS control animals and the Invivofectamine 3.0-injected
animals showed no indicators of retinal stress at 24 h post-injection. E: Outer nuclear layer (ONL) ratios measured at 24 h post-injection revealed no statistically significant differences between
the PBS-injected controls and the Invivofectamine 3.0-injected animals. F–H: Cone a-wave and b-wave responses measured from electroretinography (ERG) showed no differences between the PBS-injected
controls and the Invivofectamine 3.0-injected animals at 24 h post-injection. I: At 7 days post-injection, no differences were still seen in the ONL ratios between the two groups. J–L: Cone, a-wave and b-wave ERG responses again showed no differences at 7 days post-injection between the PBS-injected controls
and the Invivofectamine 3.0-injected animals (*p<0.05 using unpaired Student t test (E, F, I, J) and two-way ANOVA with Sidak’s post hoc test (G, H, K, L), n=6, scale bar represents 200 μm).
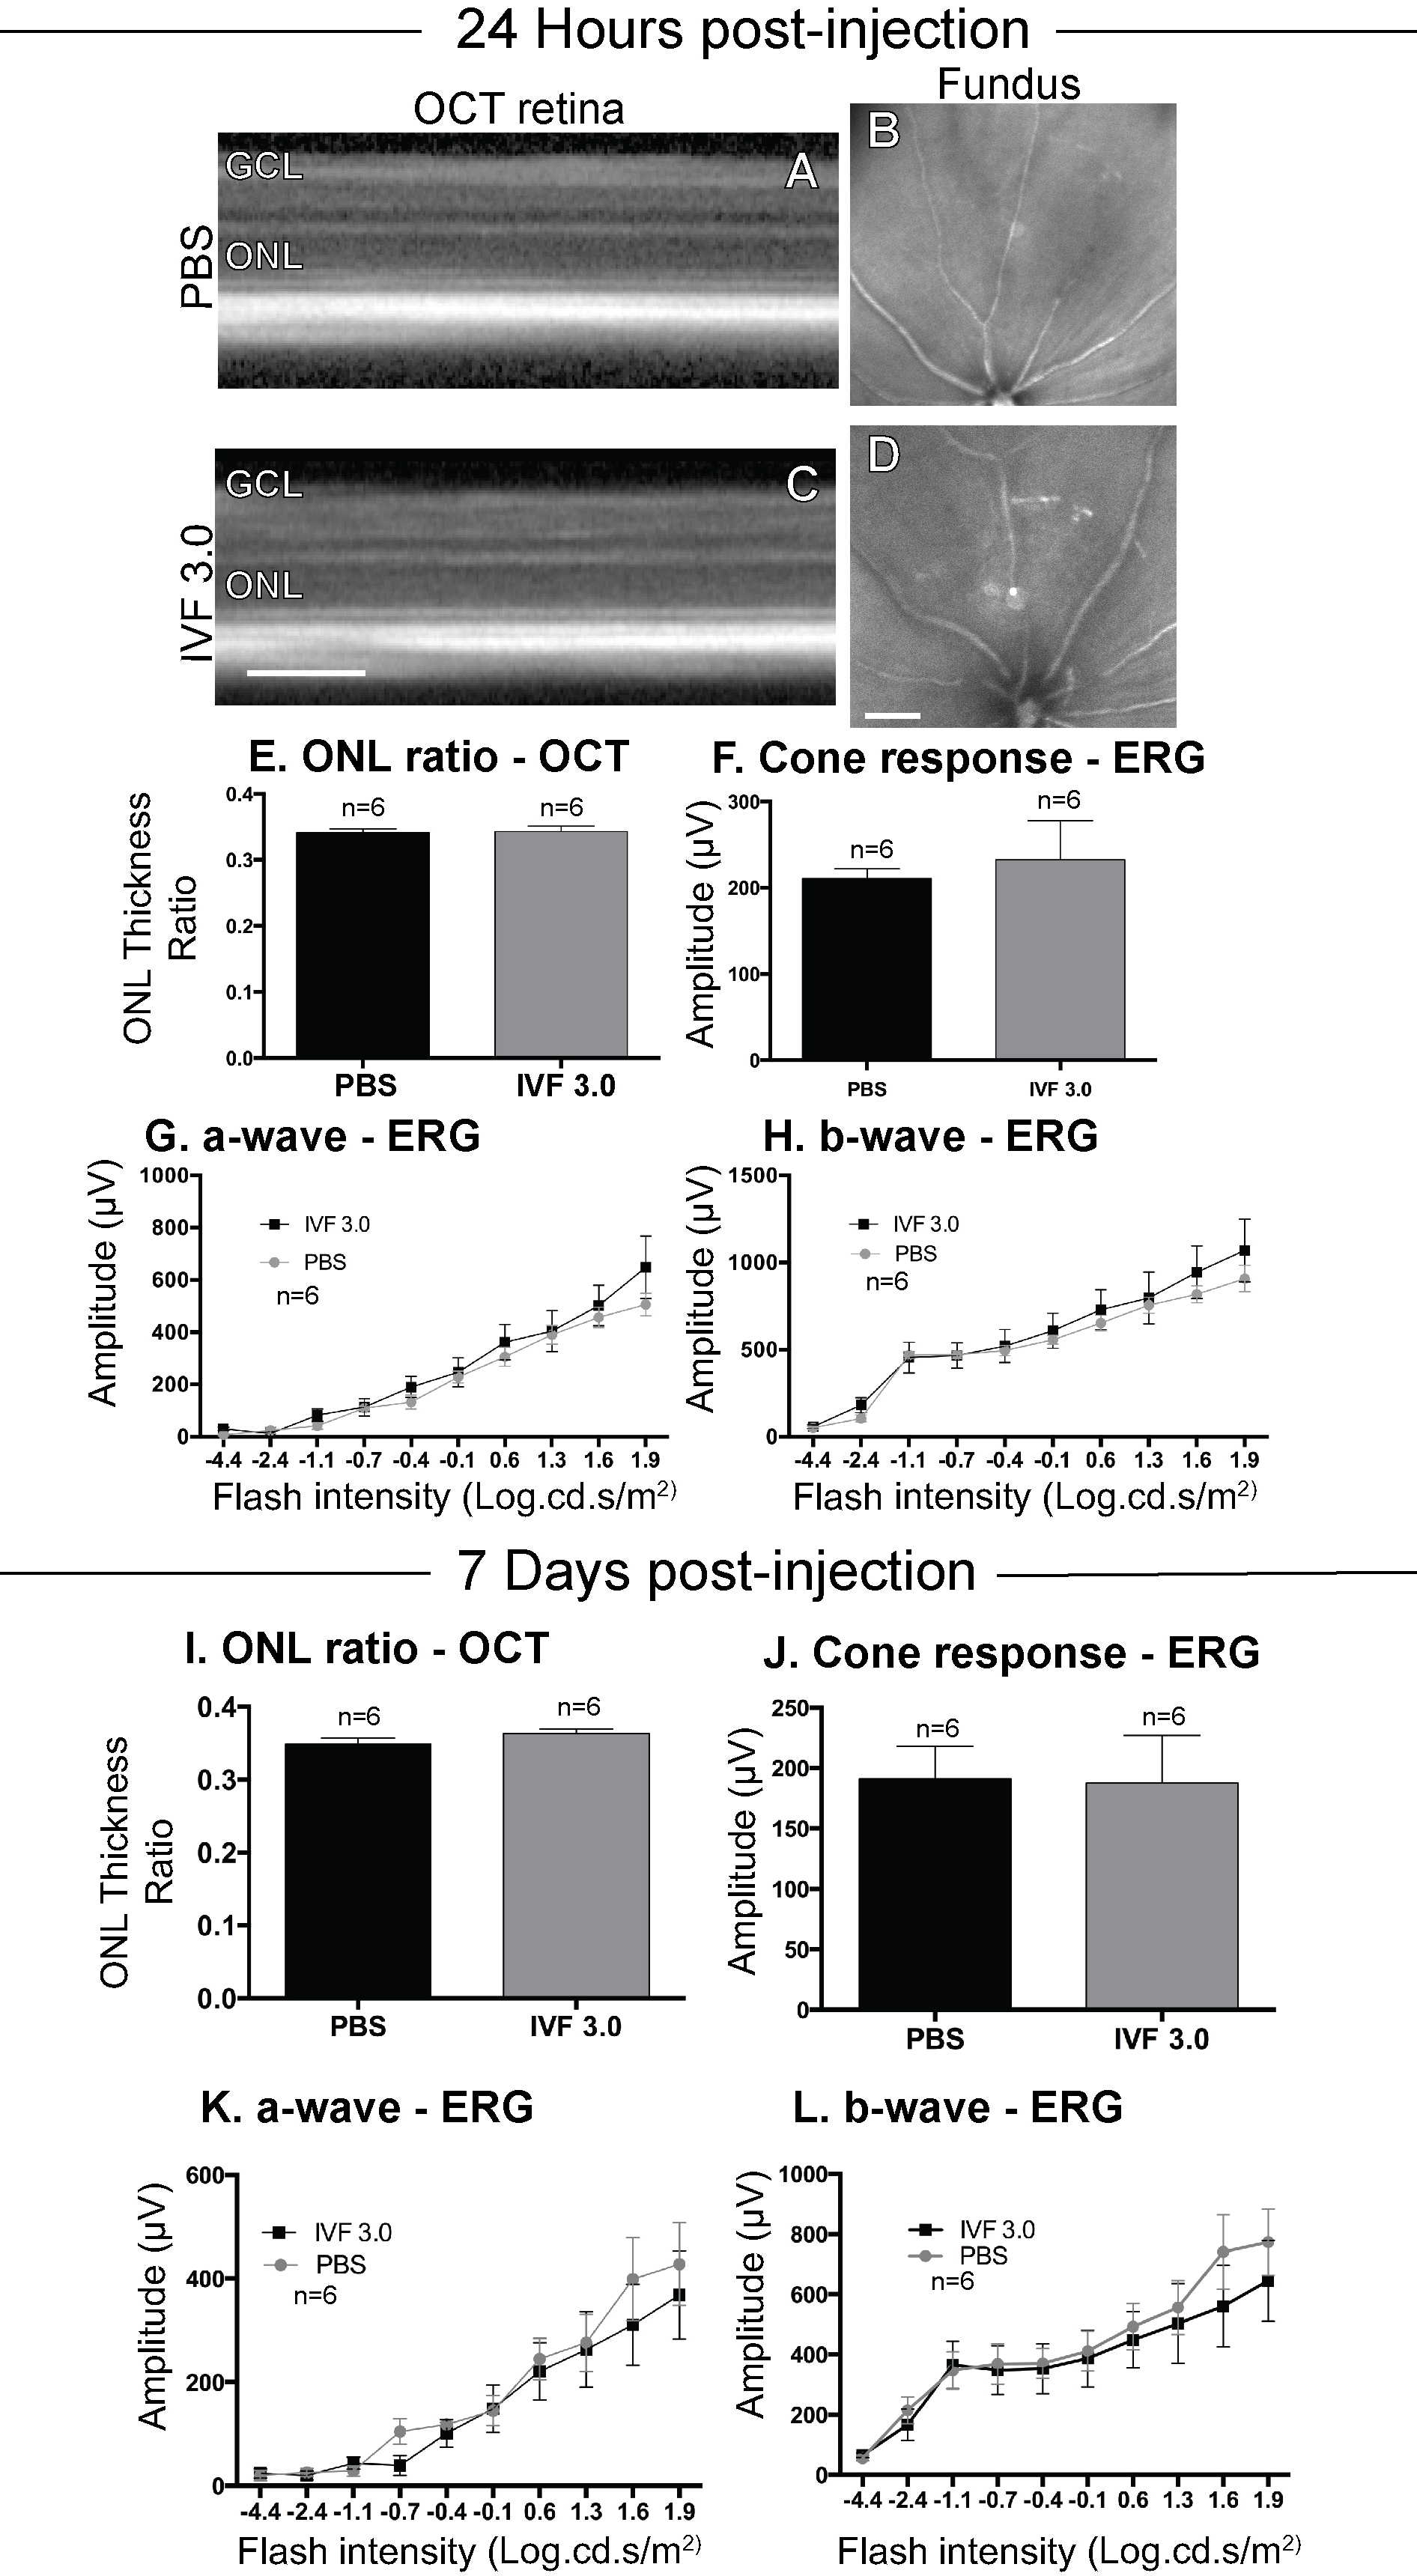
 Figure 4 of
Chu-Tan, Mol Vis 2020; 26:48-62.
Figure 4 of
Chu-Tan, Mol Vis 2020; 26:48-62.