Figure 3. Histological indicators of cellular stress in the retina 24 h post-injection. A-D: IBA1-positive microglia (labelled in red) had a normal ramified shape and distribution profile within the inner layers of
the retina. This was true for non-injected, PBS and needle stick controls as well as IVF injected animals. E-H: GFAP labelling had similar distribution profiles in controls and in treatment conditions, with a horizontal labelling pattern
present only at the inner limiting membrane (ILM) and beneath the inner nuclear layer (INL), with no evidence of radial /
vertical Müller cell process labelling. I: Quantification of IBA-1 positive cells revealed no differences between samples. J: Quantification of TUNEL-positive cells (labelling not shown) also showed no changes in the rates of cell death between samples.
K: Quantitative real-time polymerase chain reaction (qRT-PCR) showed no significant changes in expression for a suite of inflammatory
and retinal stress genes in IVF 3.0 injected animals compared to PBS injected controls. Ccl2, Il-10 and Il-6 expression were undetermined (UD, expression levels were too low for the software to detect; n=4, scale bars represent 100
μm).
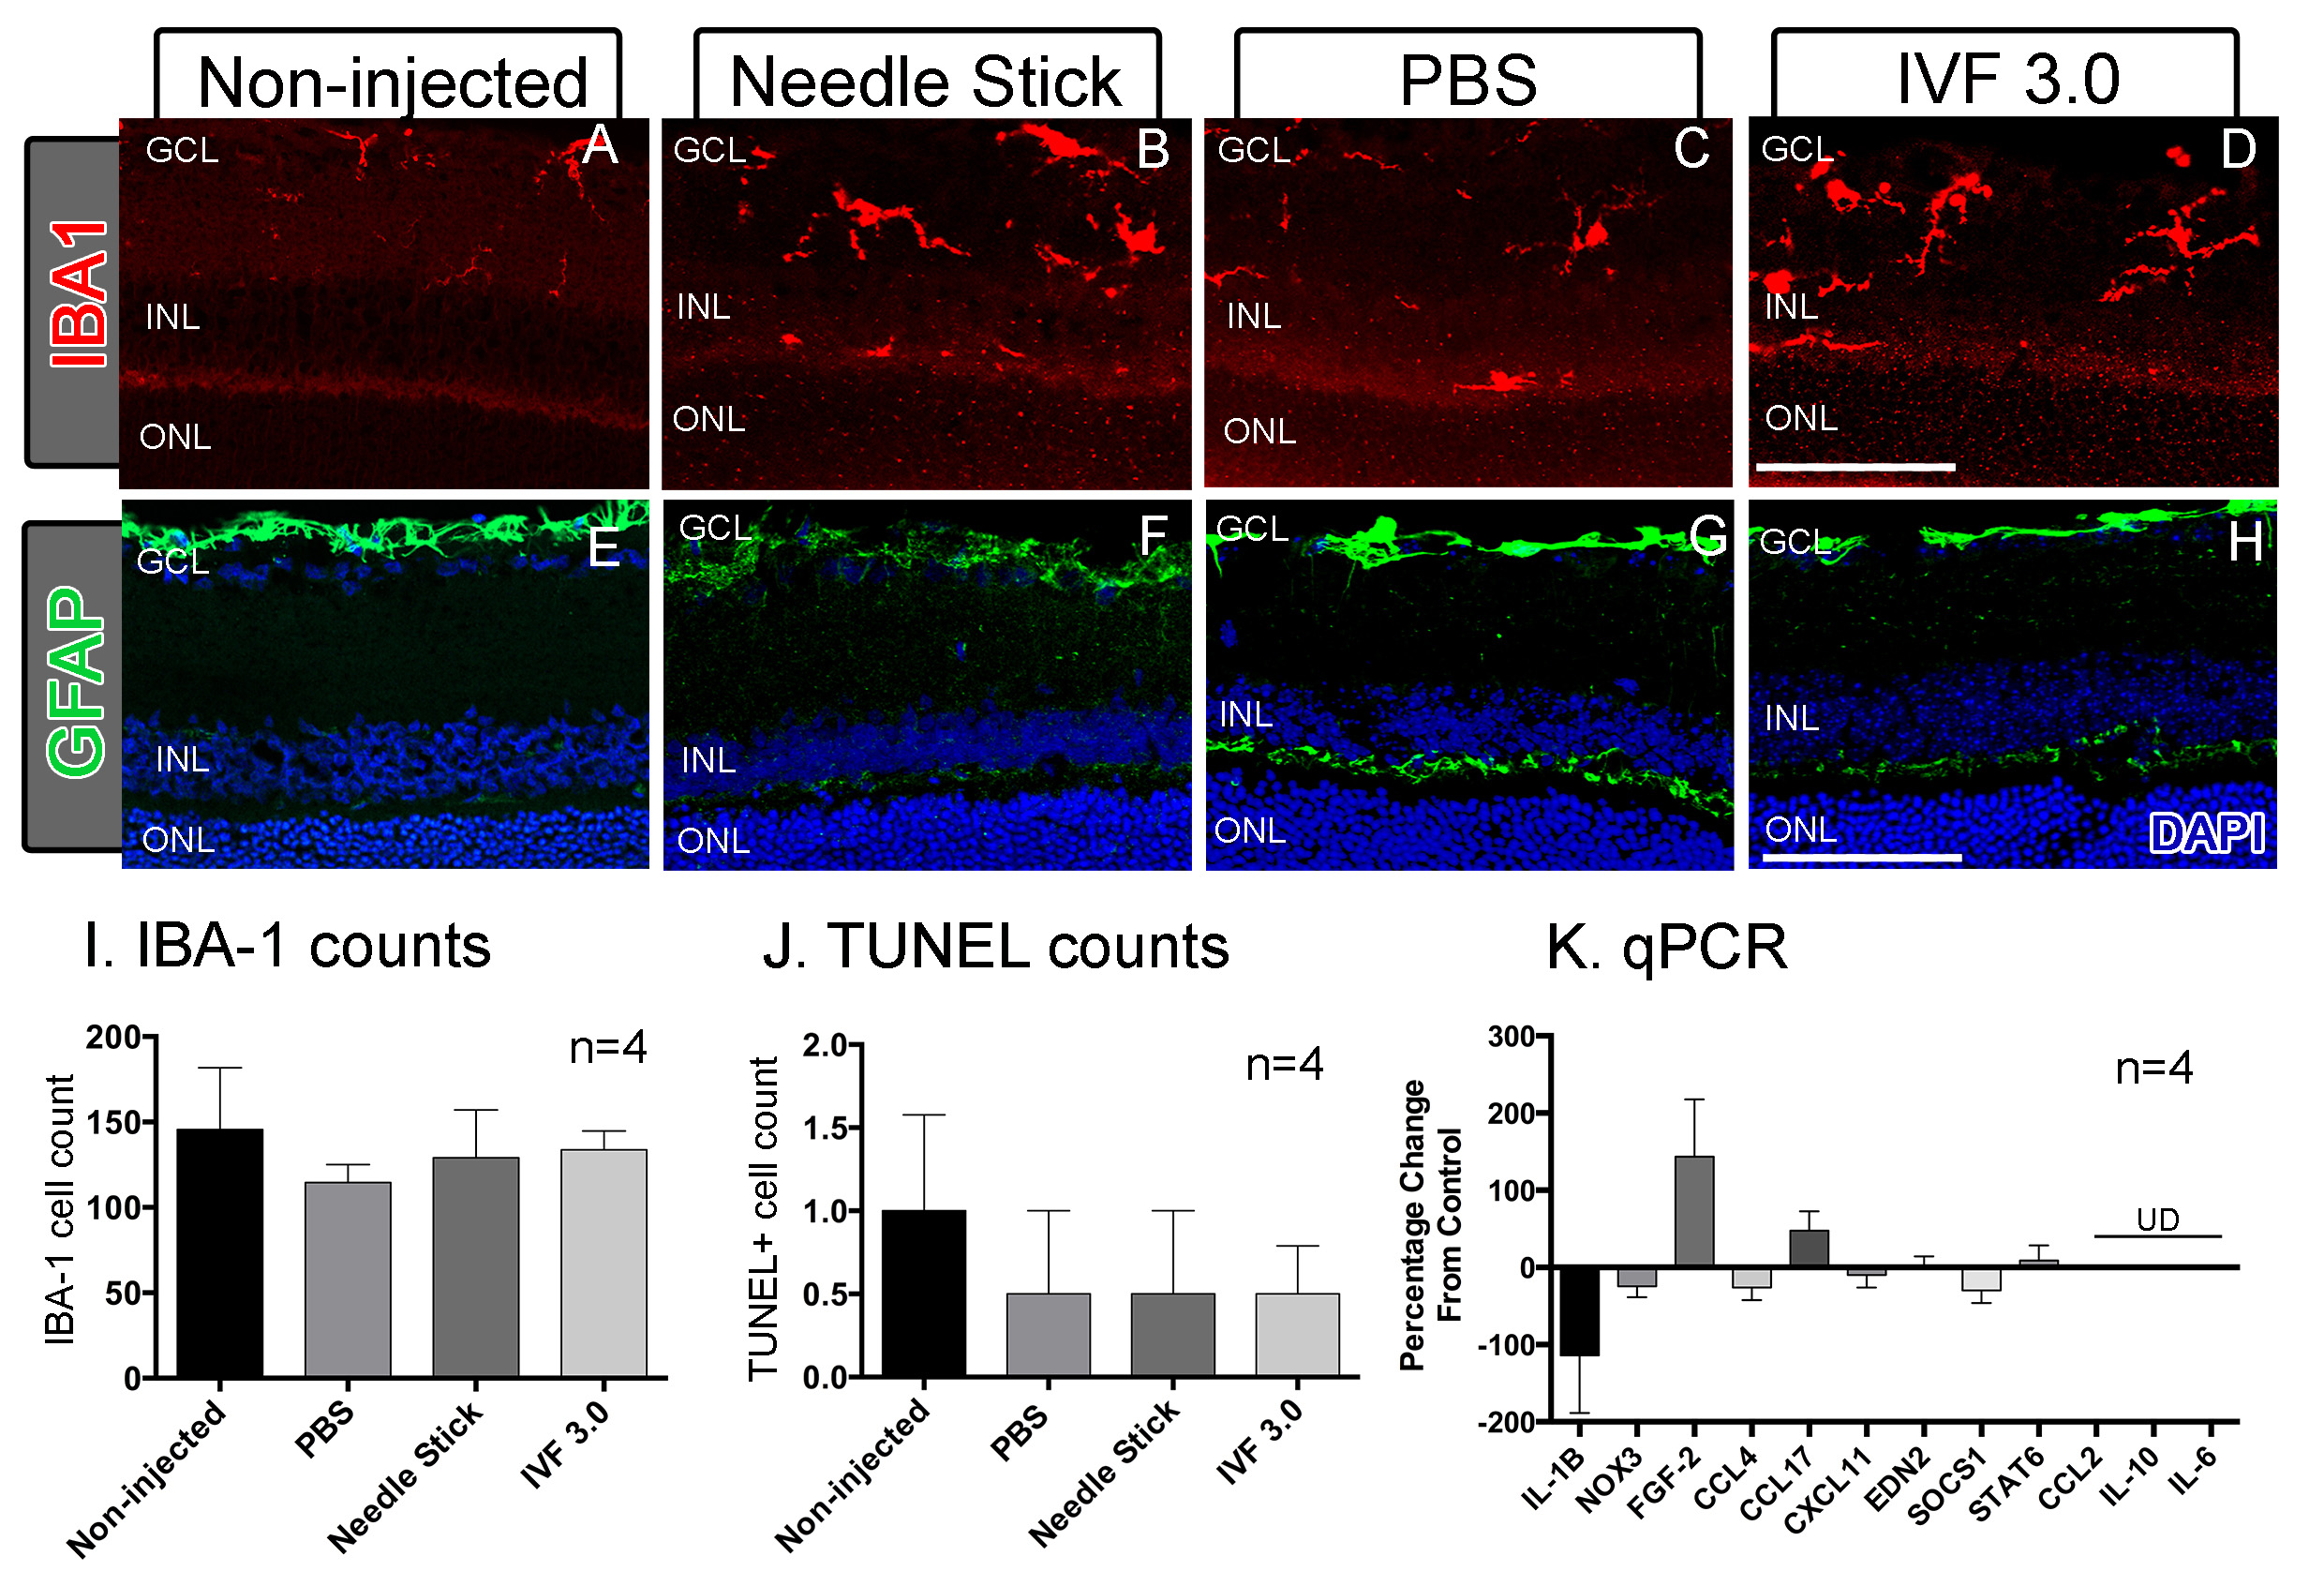
 Figure 3 of
Chu-Tan, Mol Vis 2020; 26:48-62.
Figure 3 of
Chu-Tan, Mol Vis 2020; 26:48-62.