 Appendix 1 of
Chu-Tan, Mol Vis 2020; 26:48-62.
Appendix 1 of
Chu-Tan, Mol Vis 2020; 26:48-62. Appendix 1 of
Chu-Tan, Mol Vis 2020; 26:48-62.
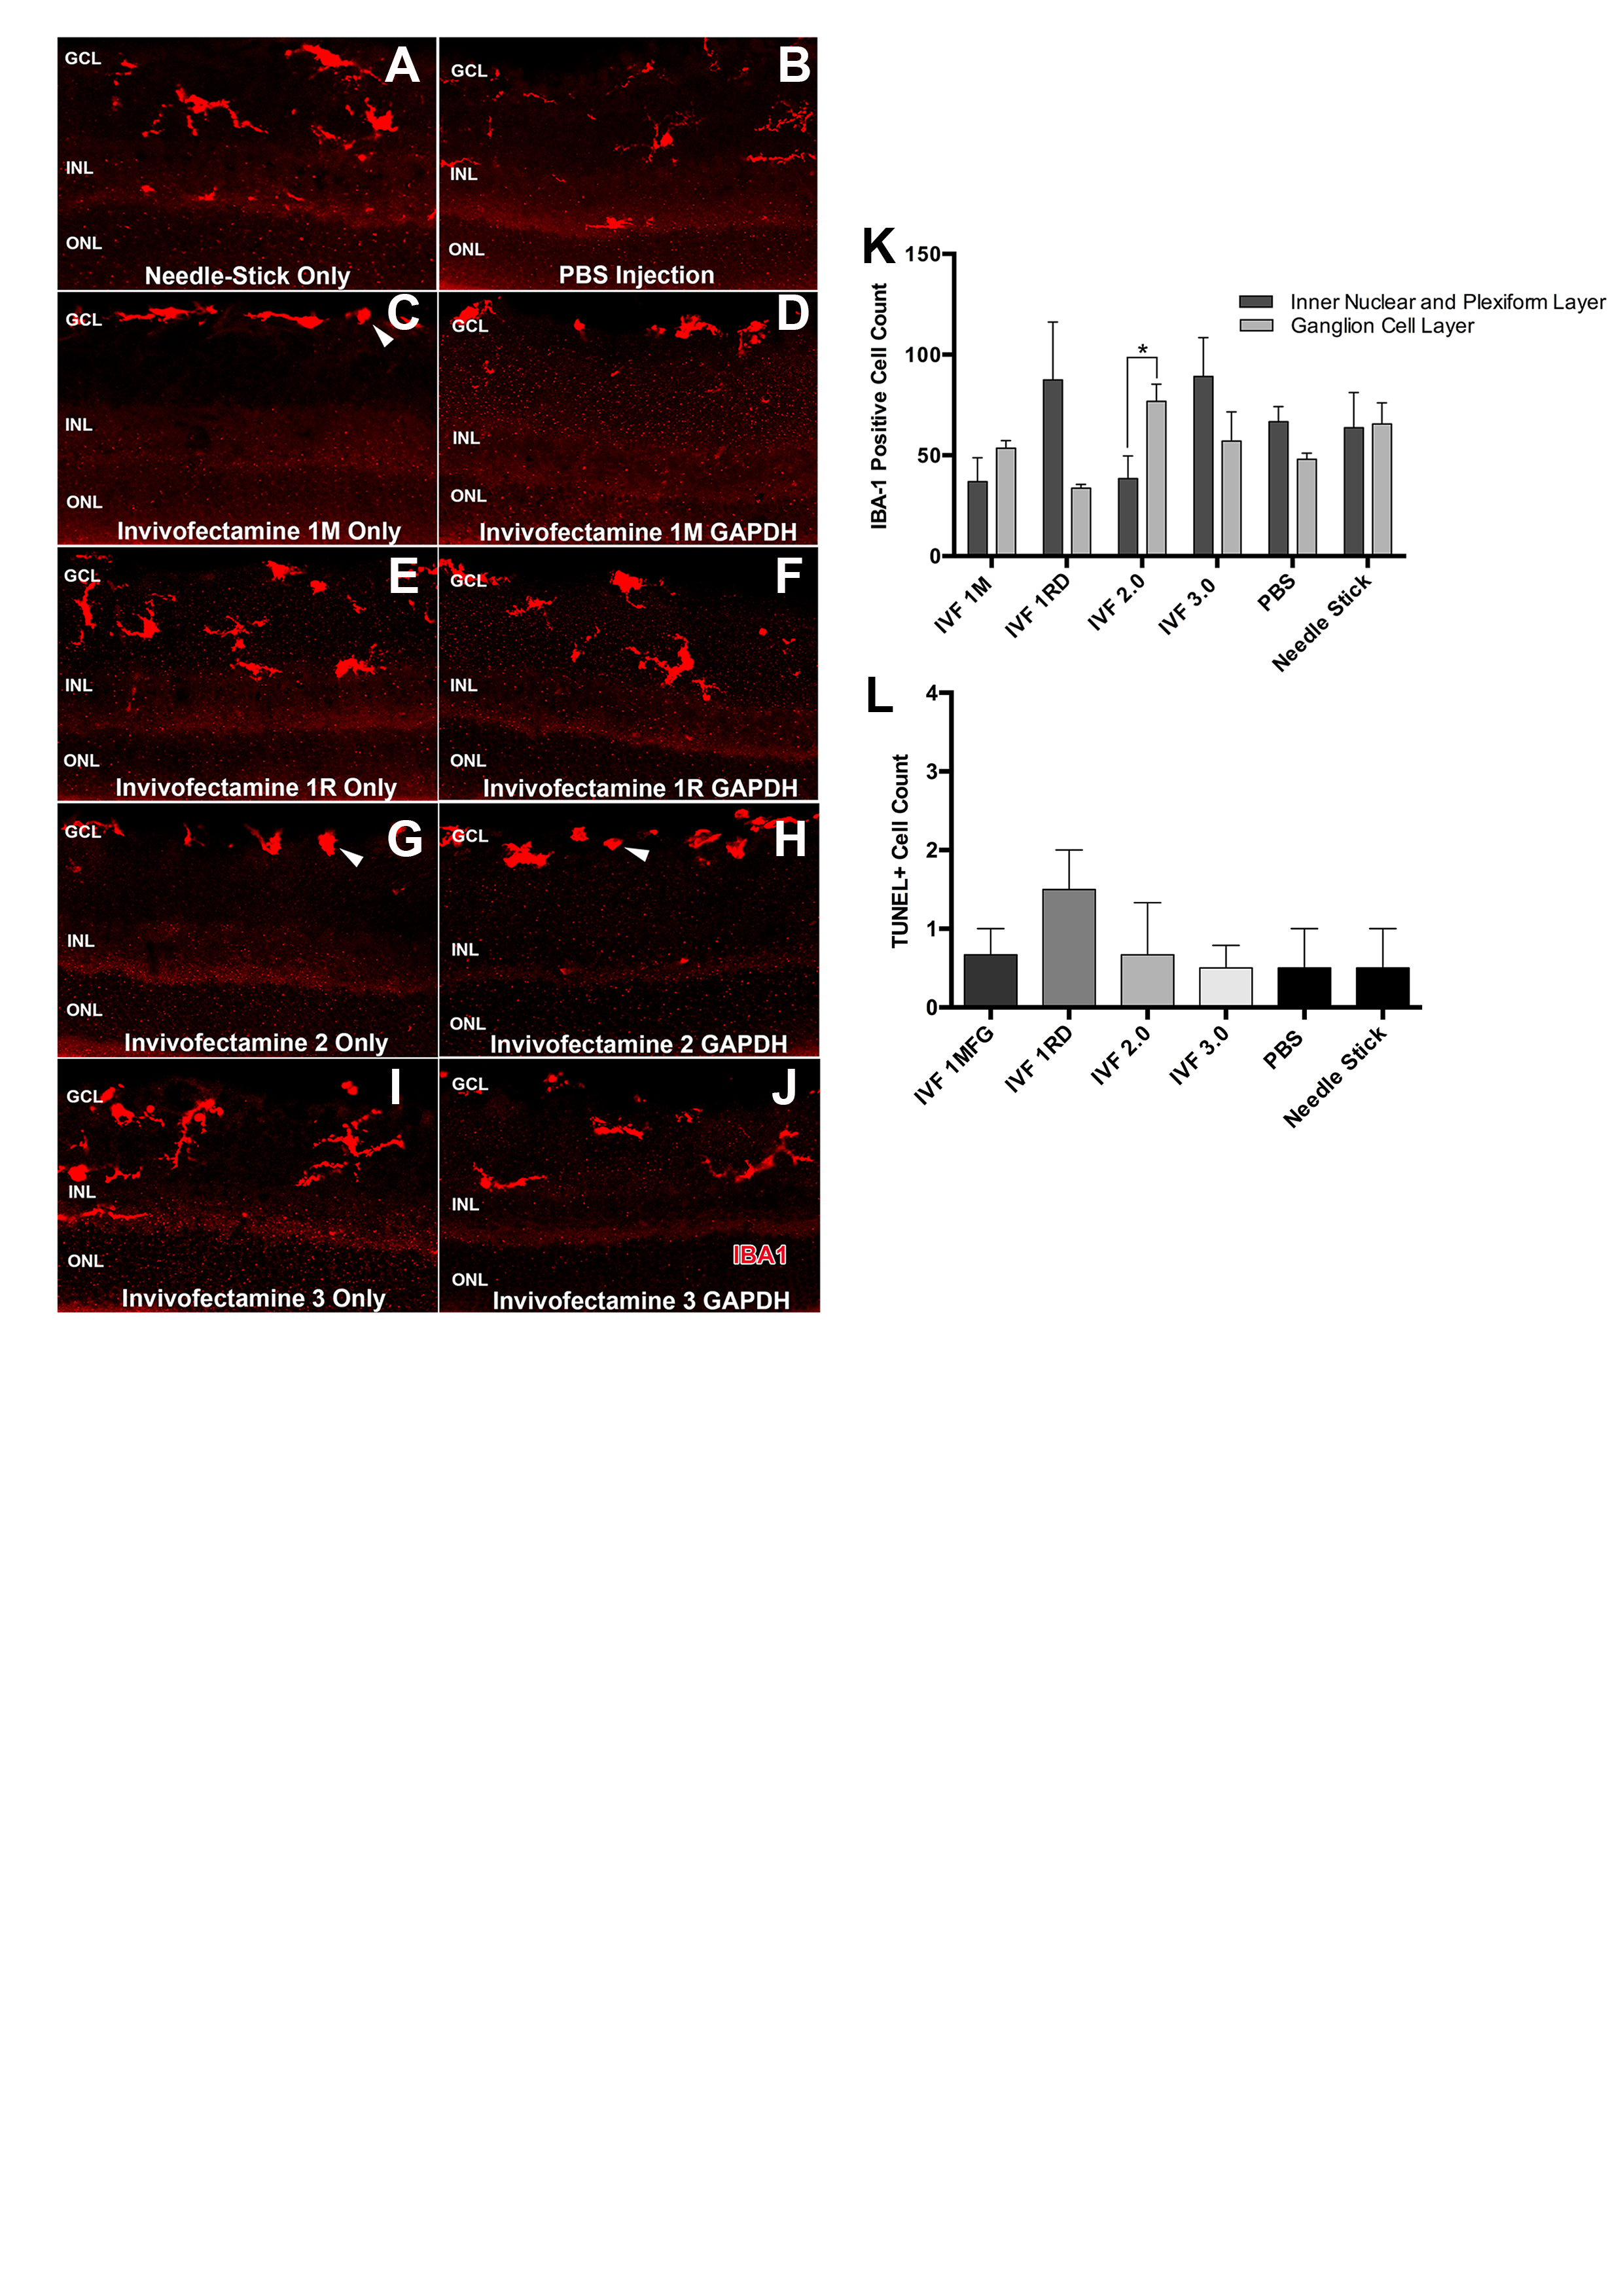
Appendix 1. Inflammatory profile of Invivofectamine formulations.
To access the data, click or select the words “Appendix 1.” (A-J) The IBA1 profile following the delivery of various Invivofectamine formulations was visualized with an increase in amoeboid, activated microglia present in Invivofectamine 1M and 2.0 formulations. (K) Quantification determined an increase in IBA1 positive microglia in Invivofectamine 2.0 in the ganglion cell layer of the retina. (L) No differences in TUNEL were observed (*p<0.05, one-way ANOVA with Tukey’s post hoc test).