Figure 2. Correlations between IL-8 and the numerical areal densities of lymphocytes (Spearman's coefficent r). Upper left: correlation
between IL-8 and the numerical areal density of CD45+ cells (r = 0.53; p = 0.002); upper right: correlation between IL-8 and
the numerical areal density of CD3+ cells (r = 0.58; p = 0.002); lower left: correlation between IL-8 and the numerical areal
density of CD4+ cells (r = 0.46; p = 0.009); lower right: correlation between IL-8 and the numerical areal density of CD8+
cells (r = 0.58; p = 0.001). Numerical areal density, NA.
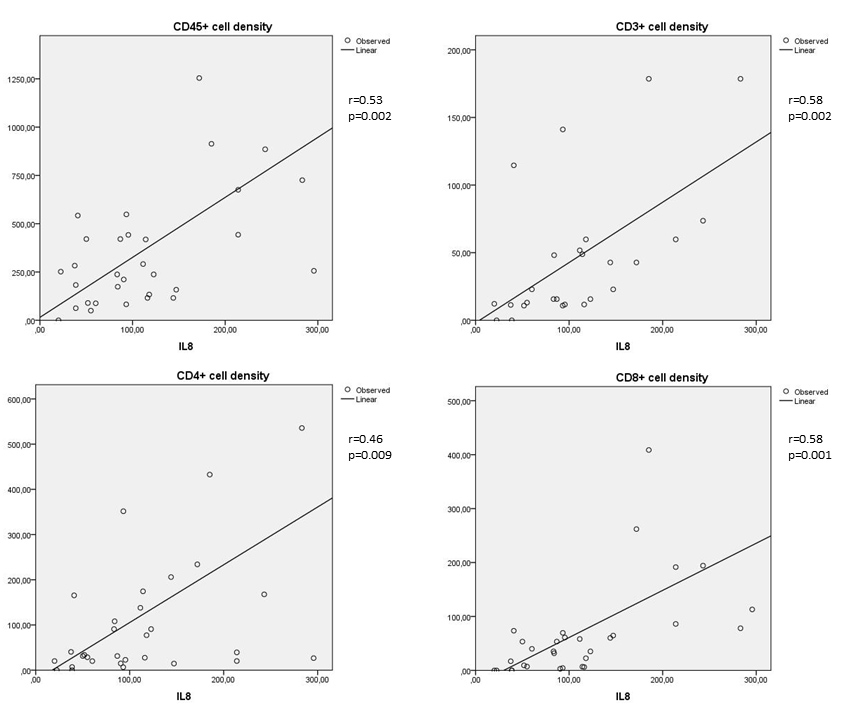
 Figure 2 of
Urbančič, Mol Vis 2020; 26:472-482.
Figure 2 of
Urbančič, Mol Vis 2020; 26:472-482.