Figure 4. A scatterplot was created for Pdgfb and expression correlations with Atf4 among the BXD strains. Each spot represented one BXD strain or its parental strain. The expression of Pdgfb genes had a statistically significant positive correlation with the expression of Atf4 genes (r = 0.628, p = 1.29e-10).
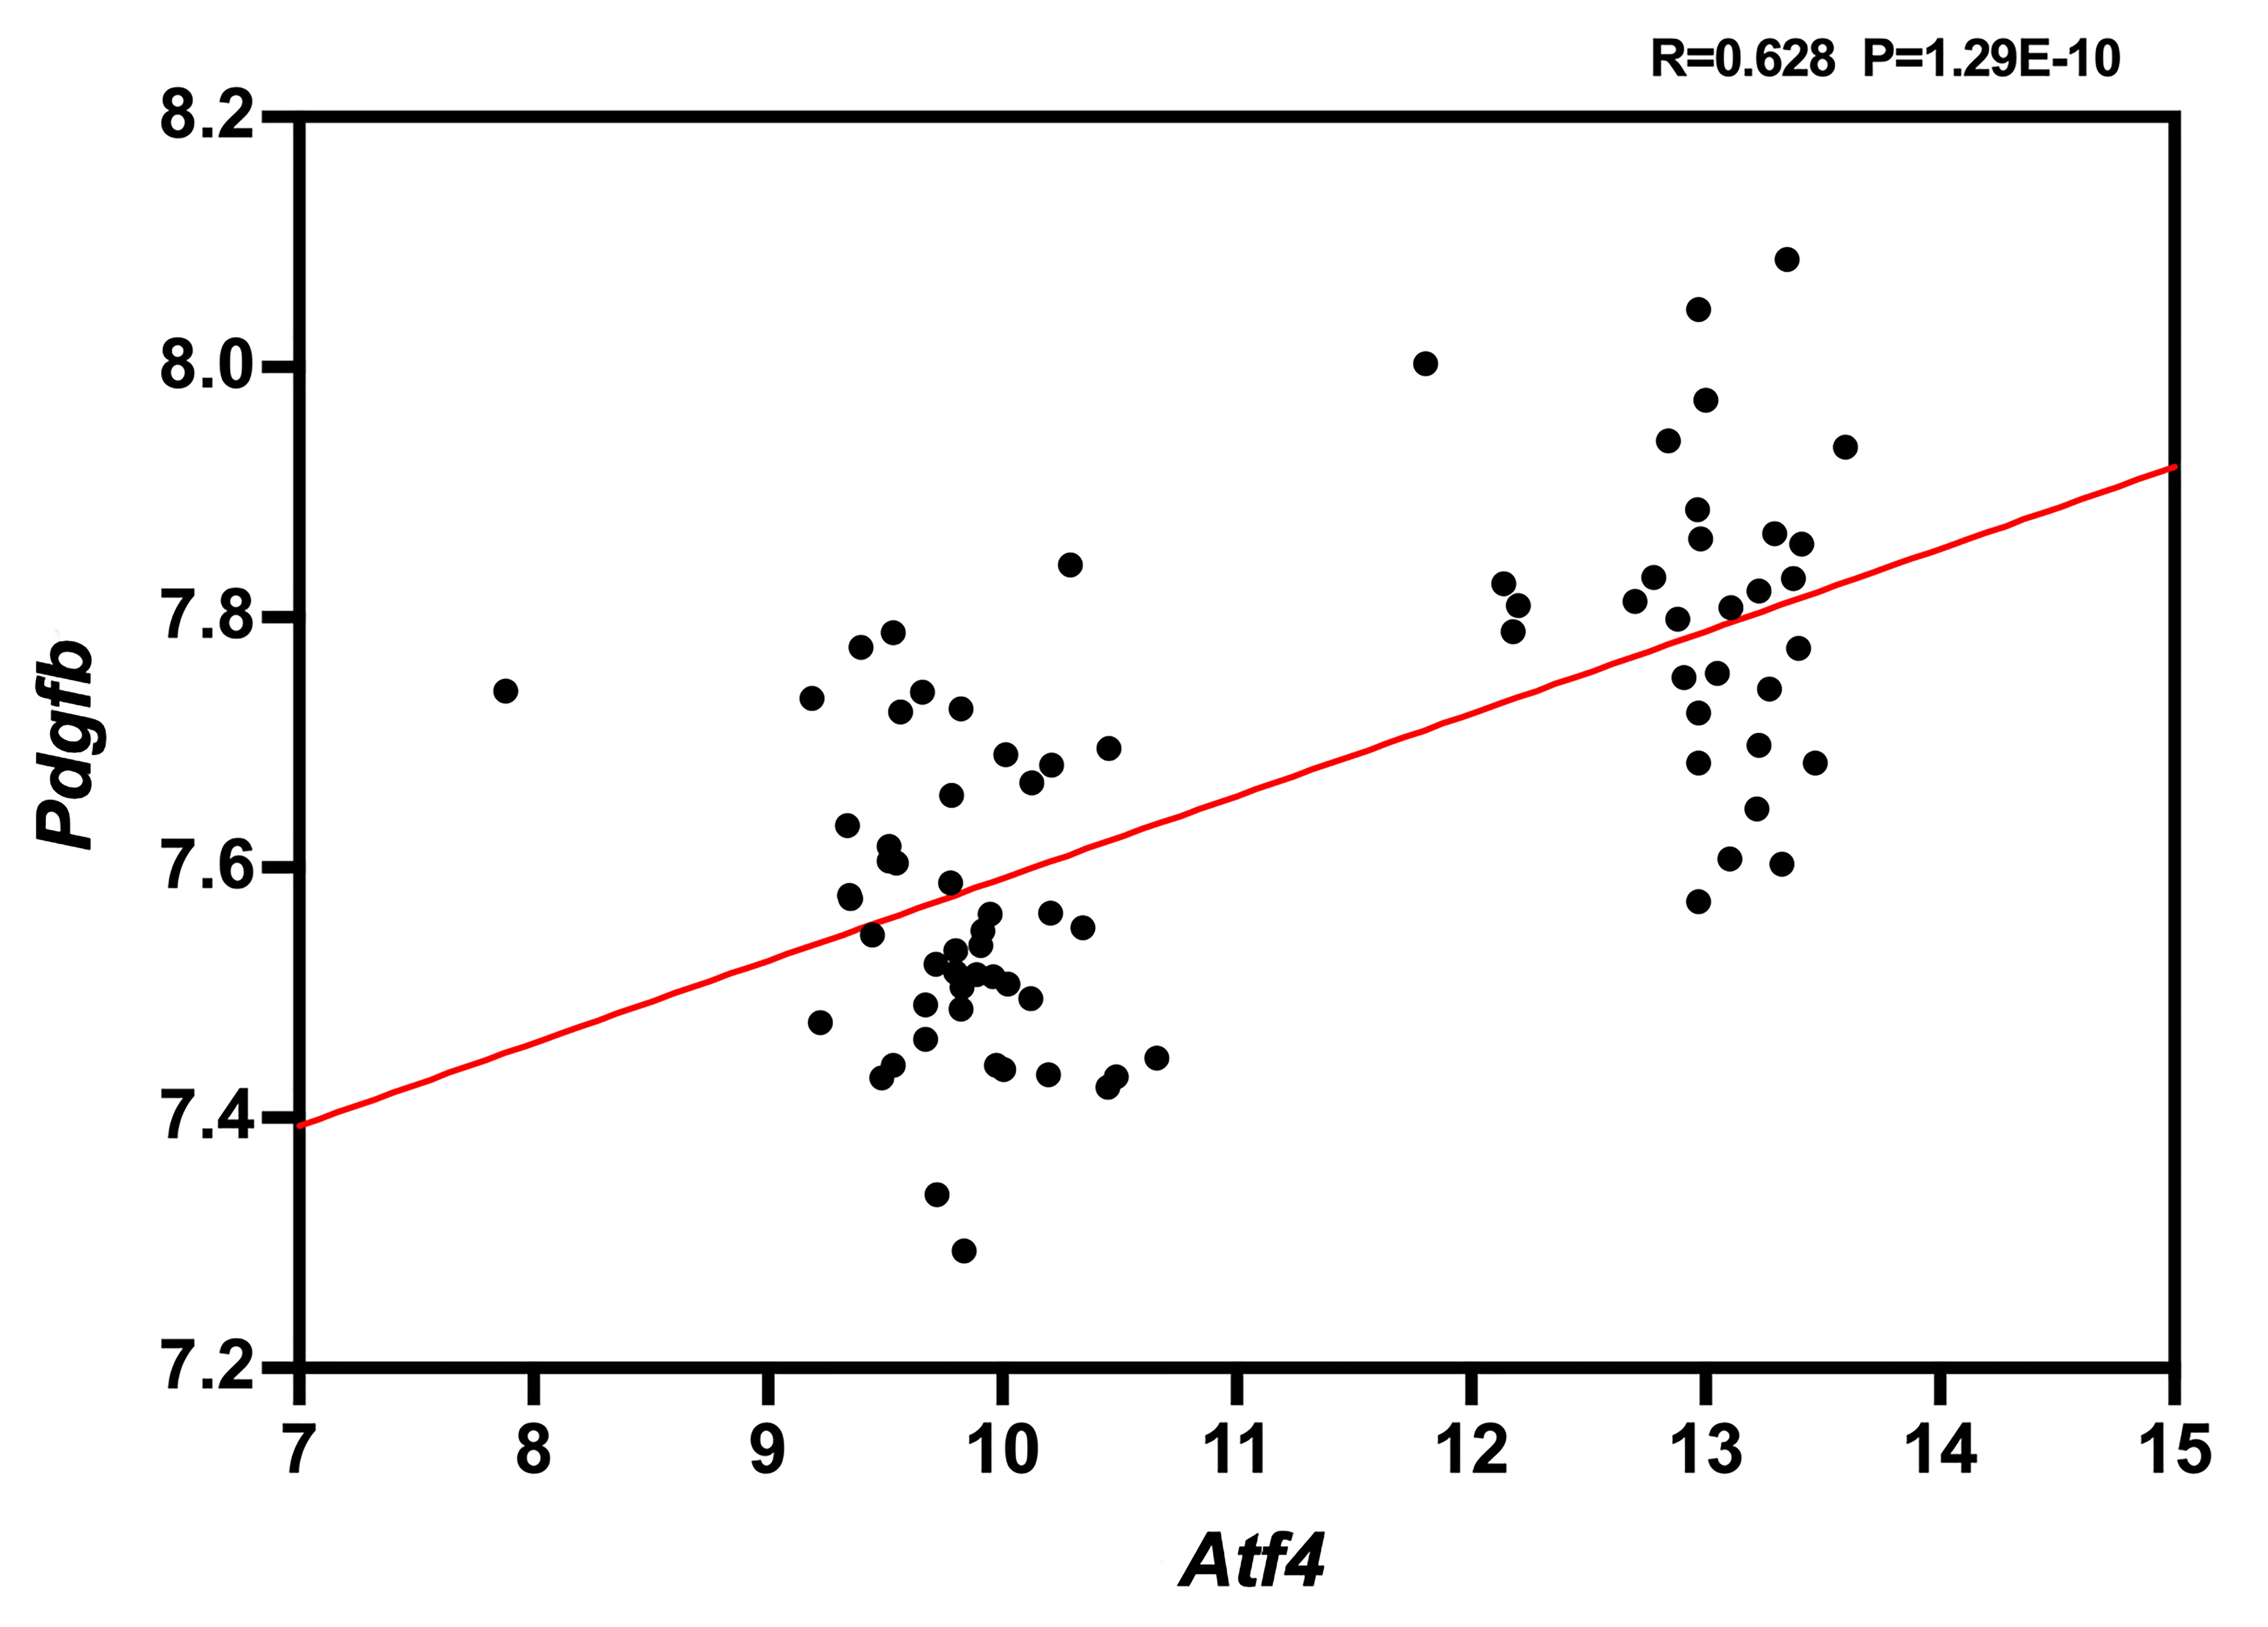
 Figure 4 of
Li, Mol Vis 2020; 26:459-471.
Figure 4 of
Li, Mol Vis 2020; 26:459-471.