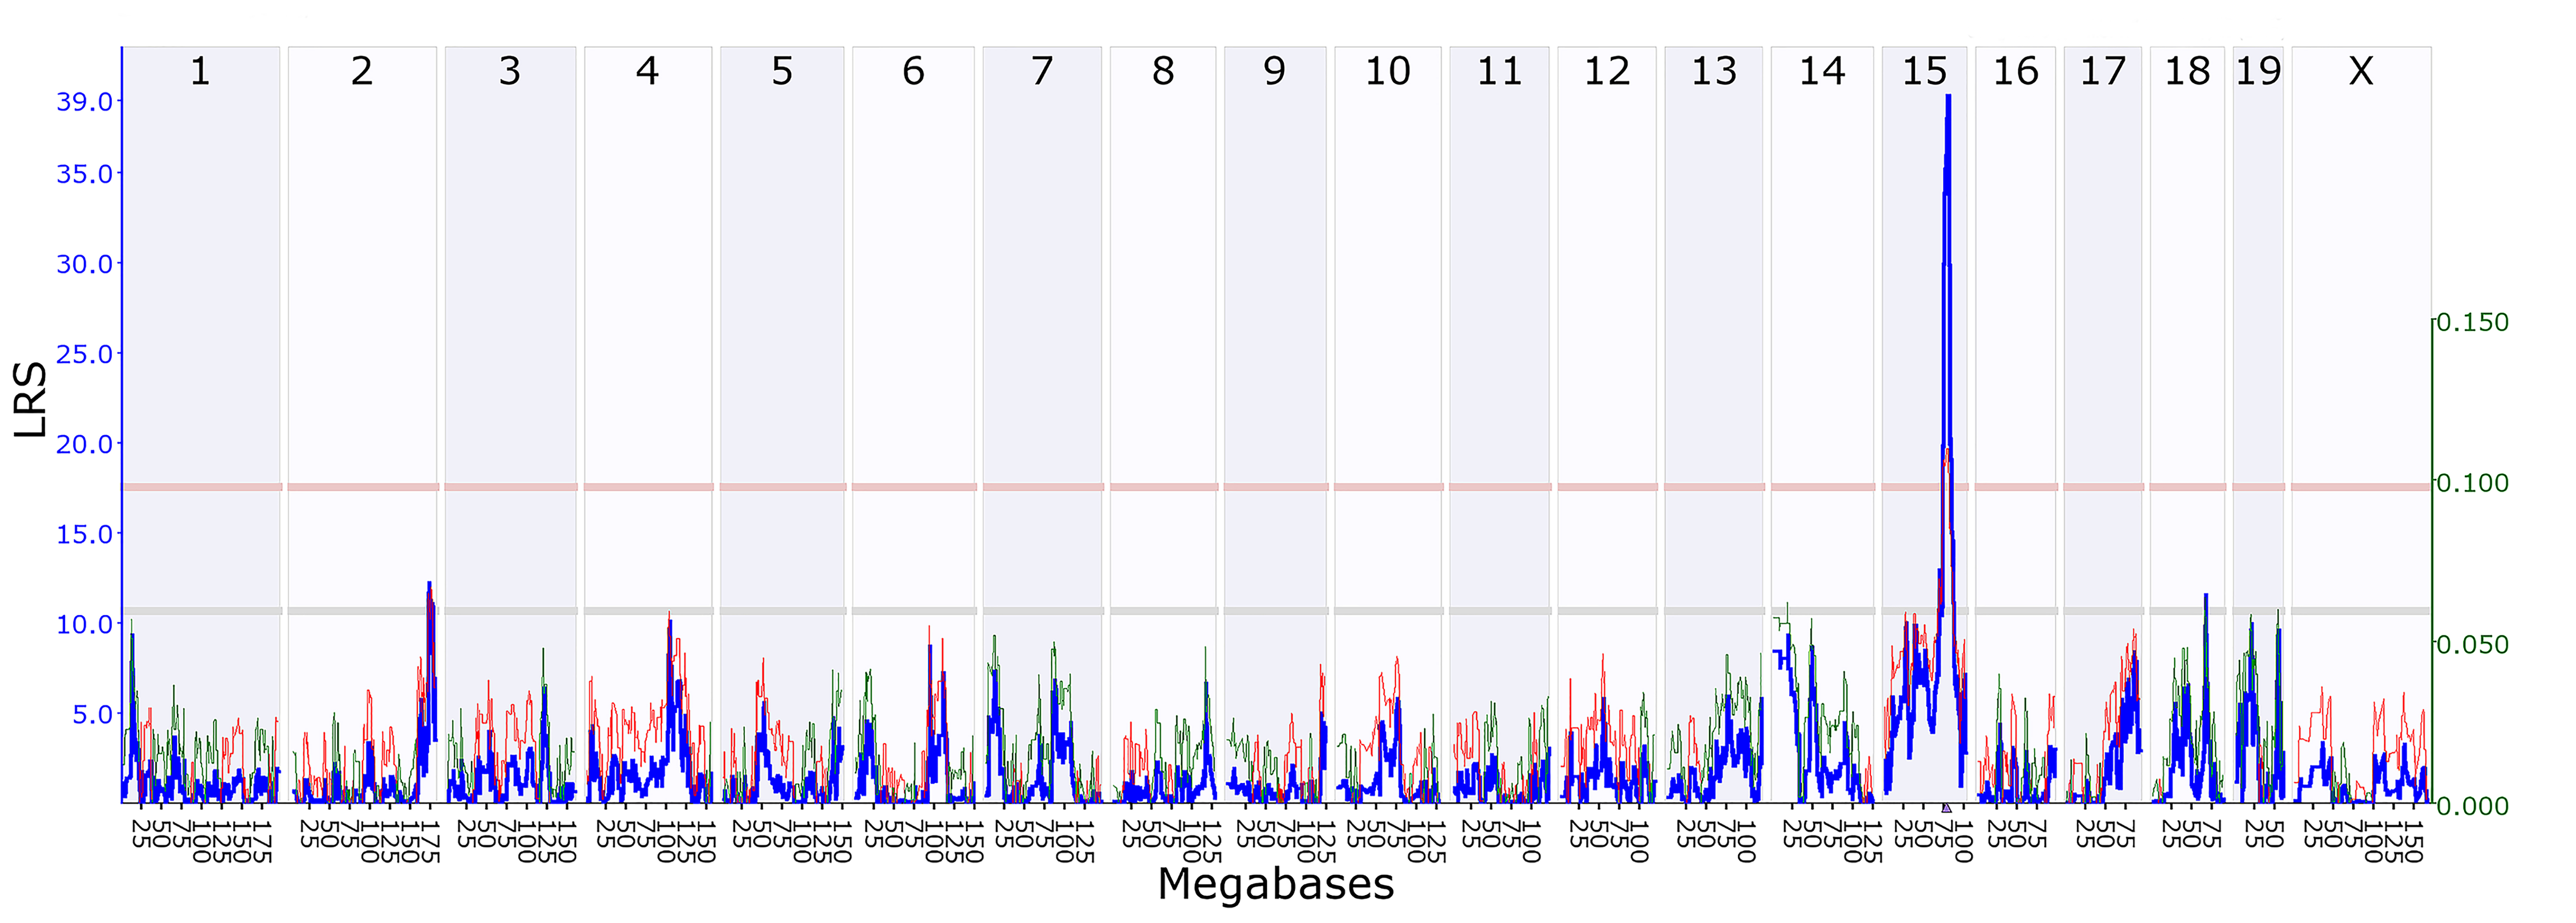
Figure 3. The interval mapping of Pdgfb in the retina was represented. A genome-wide significant expression quantitative trait locus (eQTL) was present on chromosome
15 at 80.25 Mb, which was close to the physical position of Pdgfb on chromosome 15 at 80.00 Mb and made it a cis-eQTL. The upper x-axis showed the chromosome, and the lower x-axis showed the location in megabases. The left y-axis provided
a likelihood ratio statistics (LRS) score in blue, and the right y-axis provided an additive effect. The red and green lines
showed the effects of the D and B alleles on trait values, respectively. The two horizontal lines across the plot made the
genome-wide thresholds significant (p<0.05, the pink or upper line) and suggestive (p<0.63, the gray or lower line).

 Figure 3 of
Li, Mol Vis 2020; 26:459-471.
  Figure 3 of
Li, Mol Vis 2020; 26:459-471.