Figure 2. The expression level of Pdgfb in the retina tissue for 75 BXD strains, two F1 strains (B6D2F1 and D2B6F1), and parental strains
(B6 and D2) were represented. The expression level ranges from 7.29 ± 0.12, BXD71 to 8.09 ± 0.14, BXD 16. The mean expression
of Pdgfb across all the BXD strains was 7.66 ± 0.02, with BXD16 showed the highest expression and BXD71 showed the lowest expression.
The x-axis denoted strain’s name, while the y-axis denoted the mean expression given in a log2. Each bar showed mean expression
values ± the standard error of the mean (SEM).
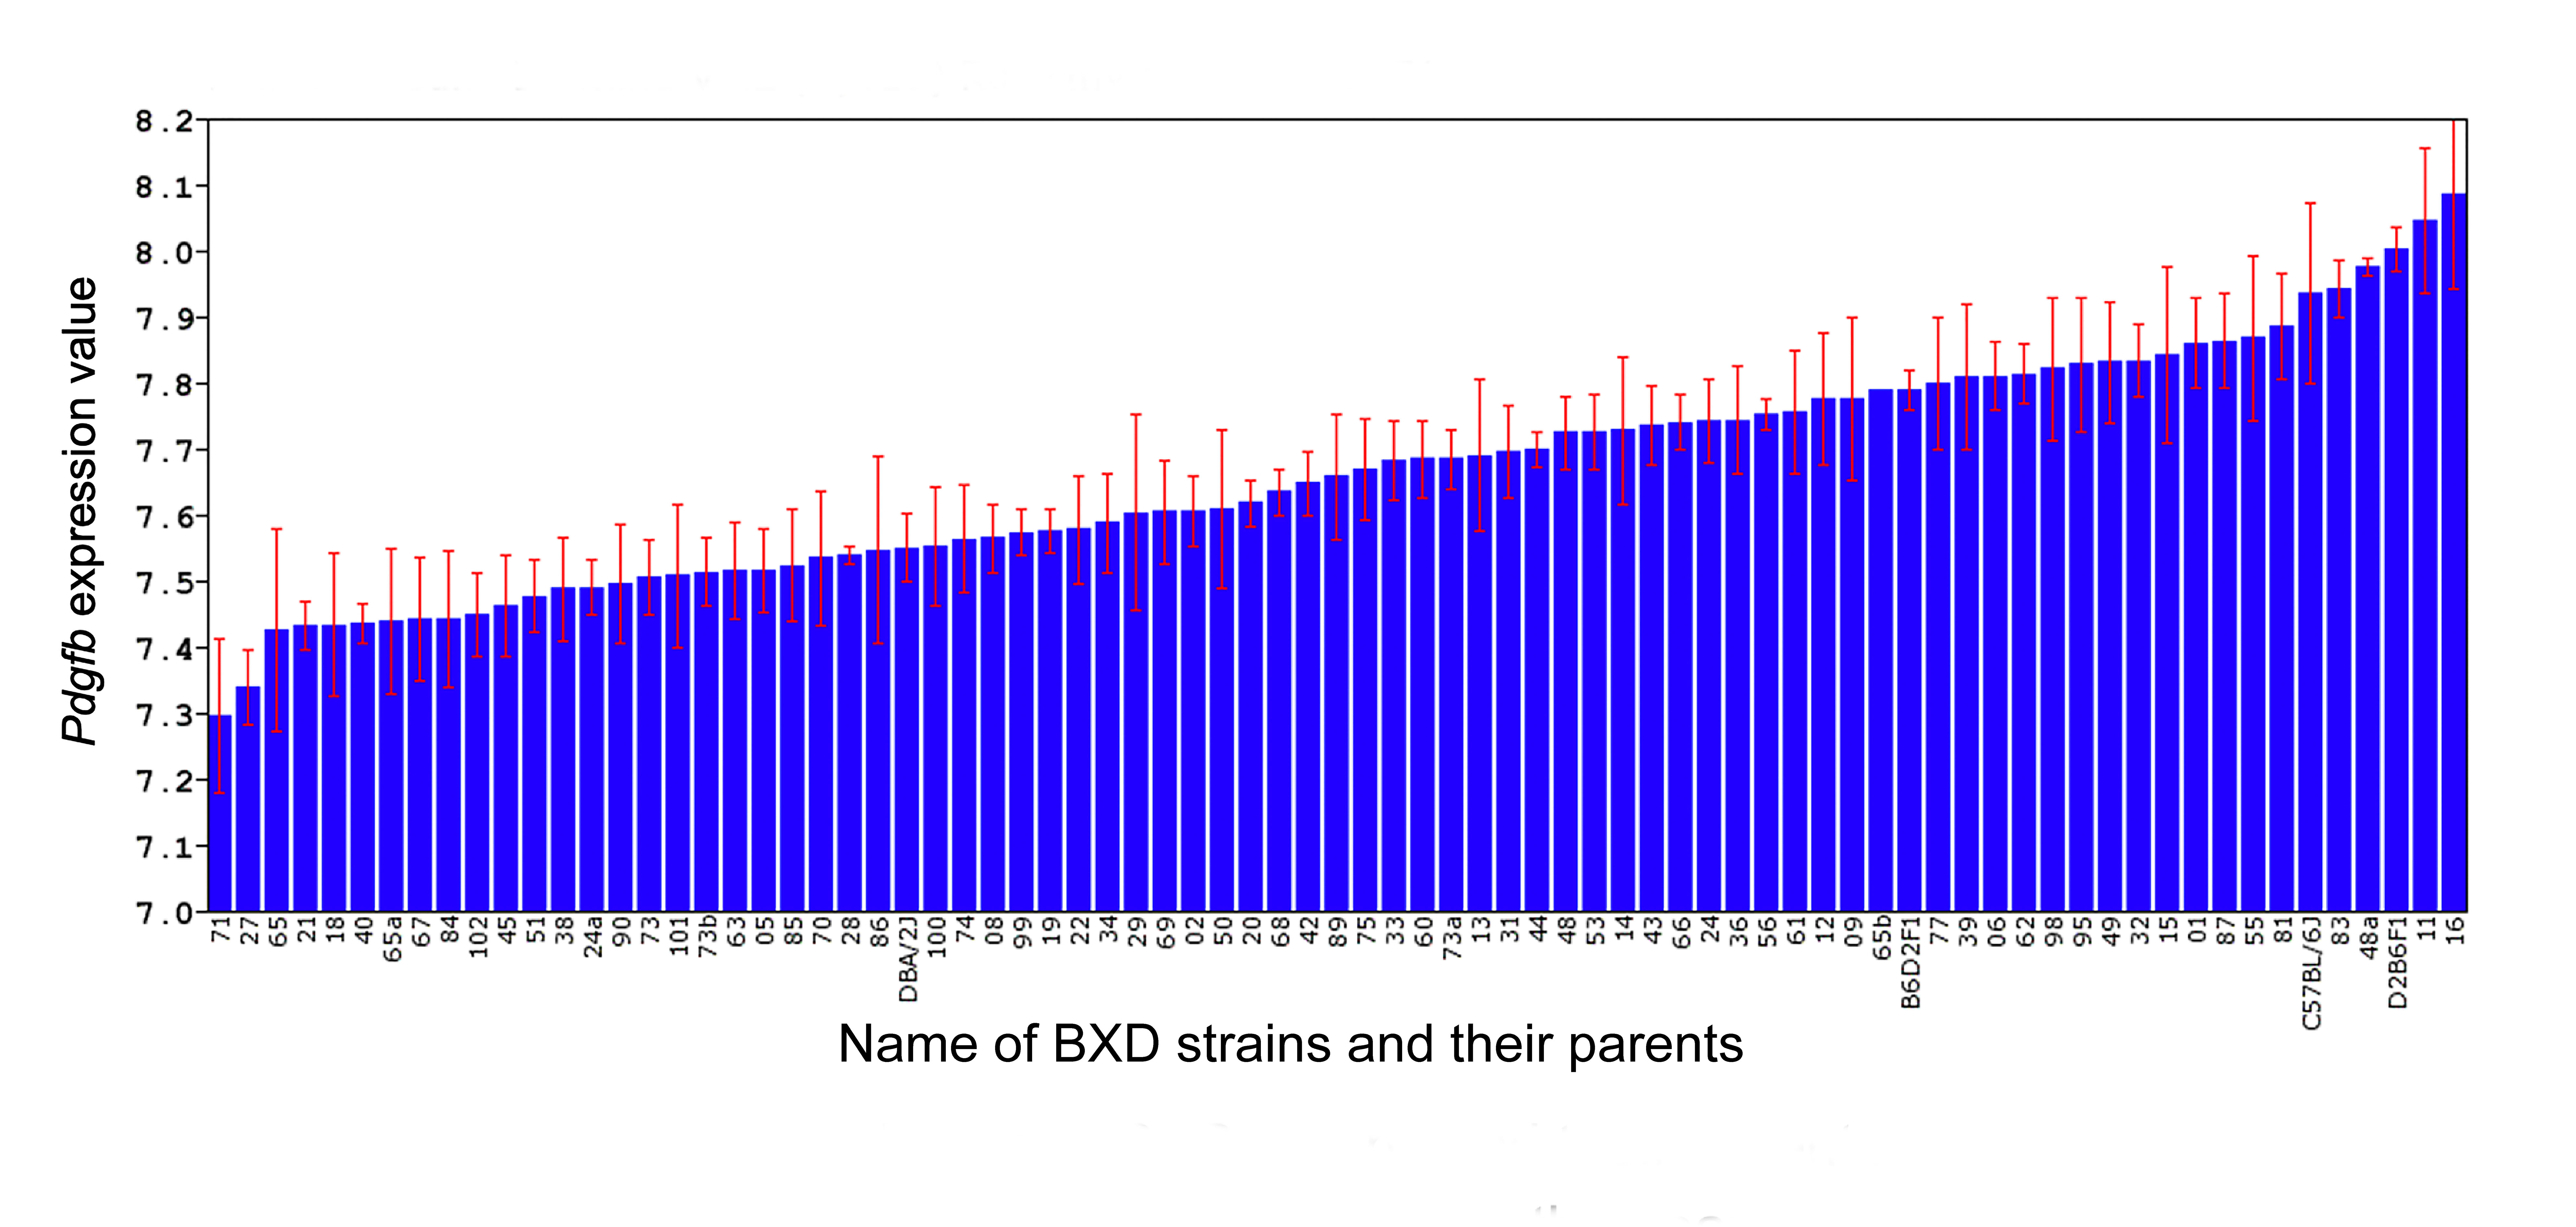
 Figure 2 of
Li, Mol Vis 2020; 26:459-471.
Figure 2 of
Li, Mol Vis 2020; 26:459-471.