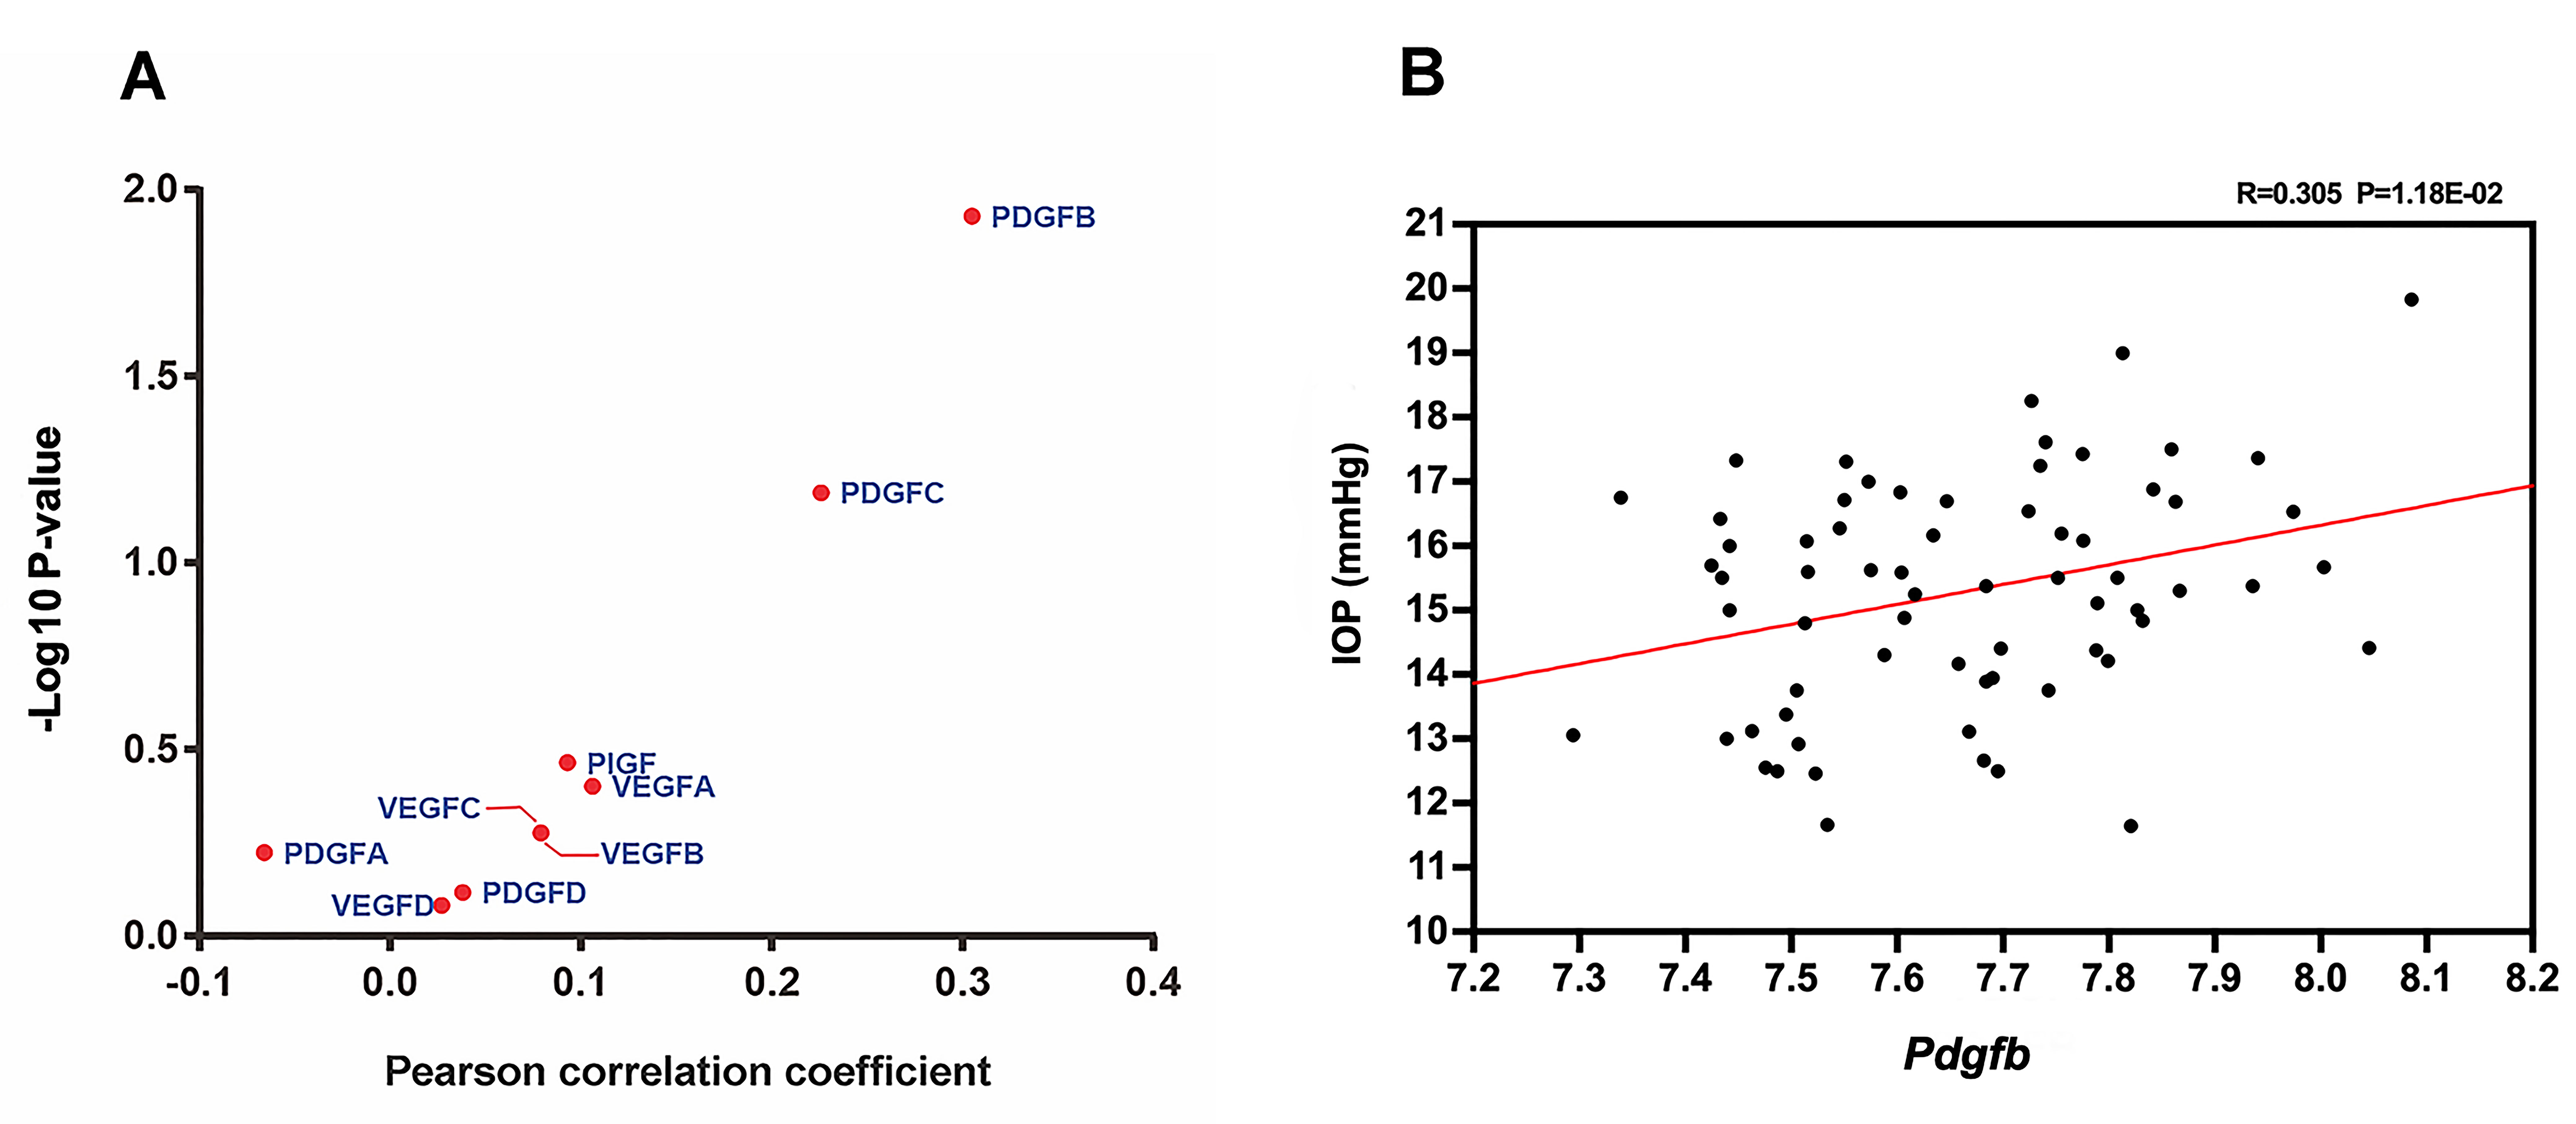
Figure 1. Expression of Pdgfb correlated with intraocular pressure (IOP). A: A volcano plot was created for Pearson correlations between IOP and members of the platelet-derived growth factor (PDGF)
and vascular endothelial growth factor (VEGF) families across the BXD strains. The y-axis represented the log10 transformed
p value of each correlation coefficient. The x-axis represented the correlation coefficient. Each spot represented a member
of the PDGF family or the VEGF family. Among the various members of the families, Pdgfb was the only member significantly correlated with IOP. B: A scatterplot was created for correlations of IOP (y-axis) with expression levels of Pdgfb (x-axis) among the BXD strains. Each spot represented a BXD strain or its parental strain. There was a statistically significant
positive correlation between the expression of Pdgfb and IOP (r = 0.305; p = 0.012). IOP was measured for mice of both sexes about two months old, and the value that was represented
was the average for the left and right eyes.

 Figure 1 of
Li, Mol Vis 2020; 26:459-471.
  Figure 1 of
Li, Mol Vis 2020; 26:459-471.