Figure 5. Immunofluorescence analysis of cross sections. A: Exemplary images of cross sections obtained from the buffer-treated (left), control vector-NMDA-treated (middle), and therapeutic
vector-NMDA-treated (right) groups. Red: GFAP, Blue: DAPI. Images were captured at a distance of 1,000 µm from the ONH. Scale
bar represents 100 μm. B: Quantification of GFAP-positive area in the three groups (buffer only, n = 4; control vector-NMDA, n = 3; therapeutic vector-NMDA,
n = 3, *p<0.05 and **p<0.01 in SNK test).
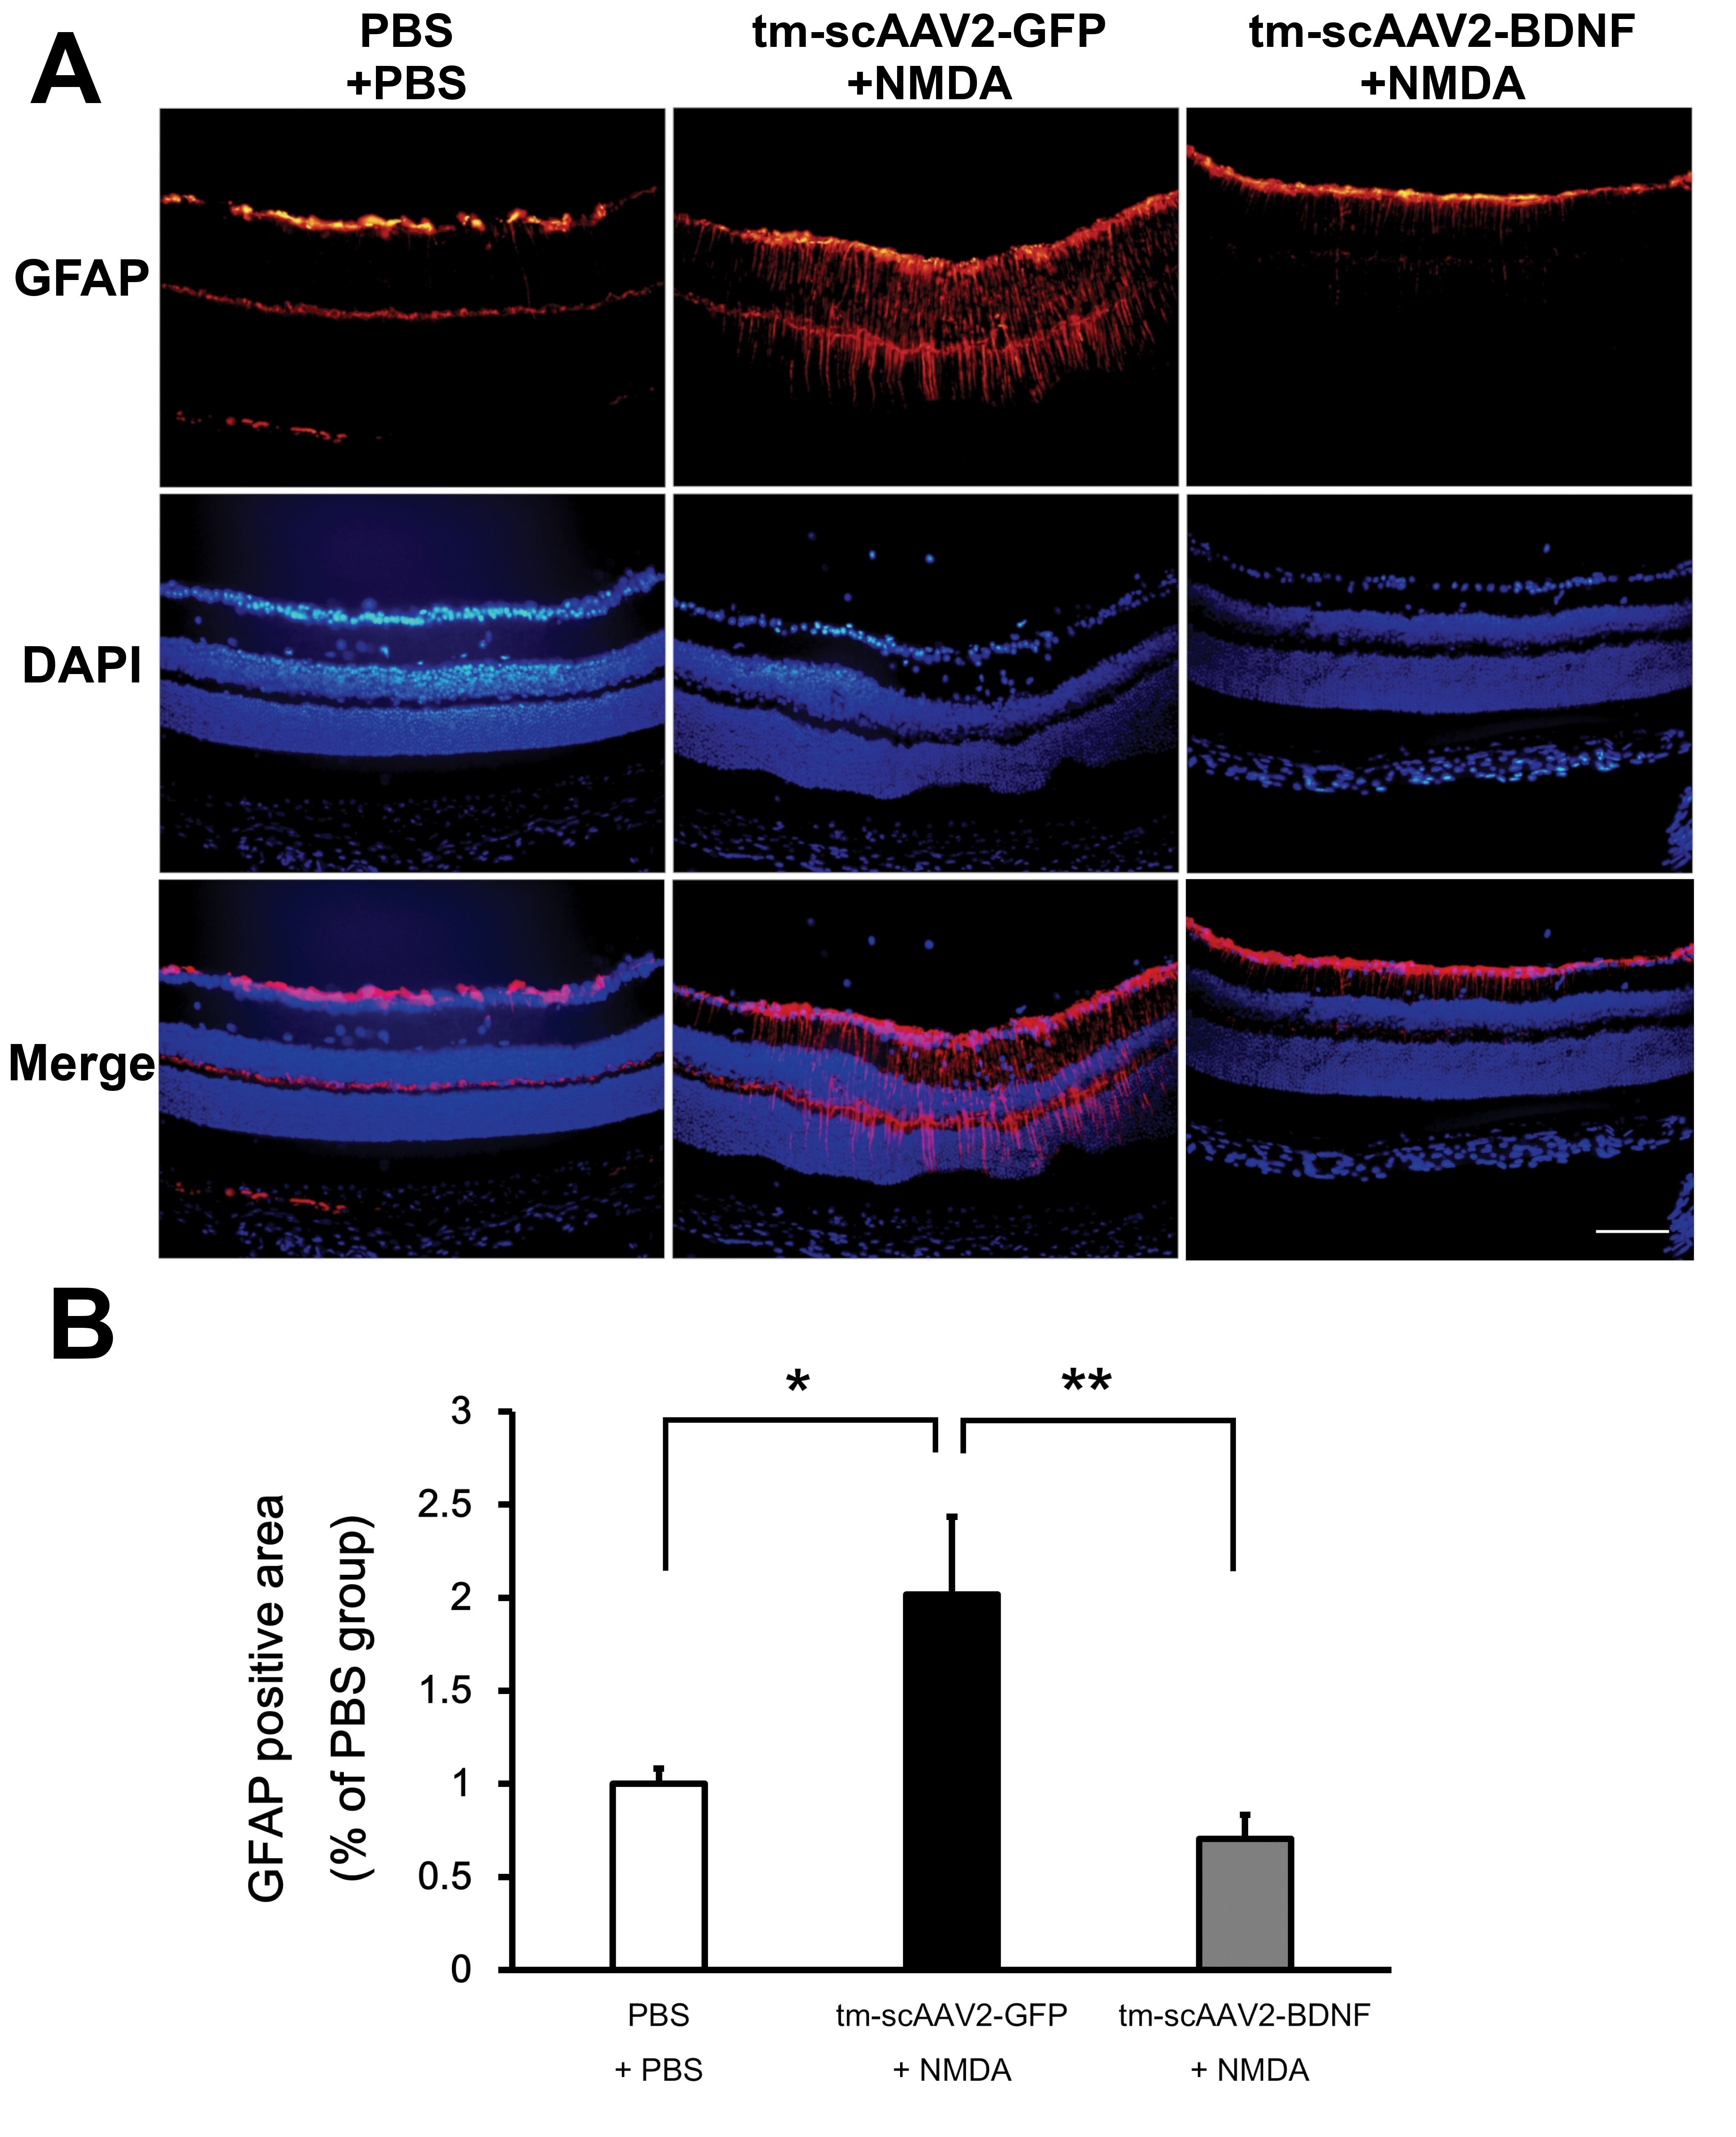
 Figure 5 of
Shiozawa, Mol Vis 2020; 26:409-422.
Figure 5 of
Shiozawa, Mol Vis 2020; 26:409-422.