Figure 4. ERG. A: Representative ERG waveforms from the buffer-treated (left), control vector-NMDA-treated (middle), and therapeutic vector-NMDA-treated
(right) groups. B: Statistical analysis of the a- and b-waves of each group (buffer only, n = 4; control vector-NMDA, n = 8; therapeutic vector-NMDA,
n = 12, *p<0.05 and **p<0.01 in SNK test).
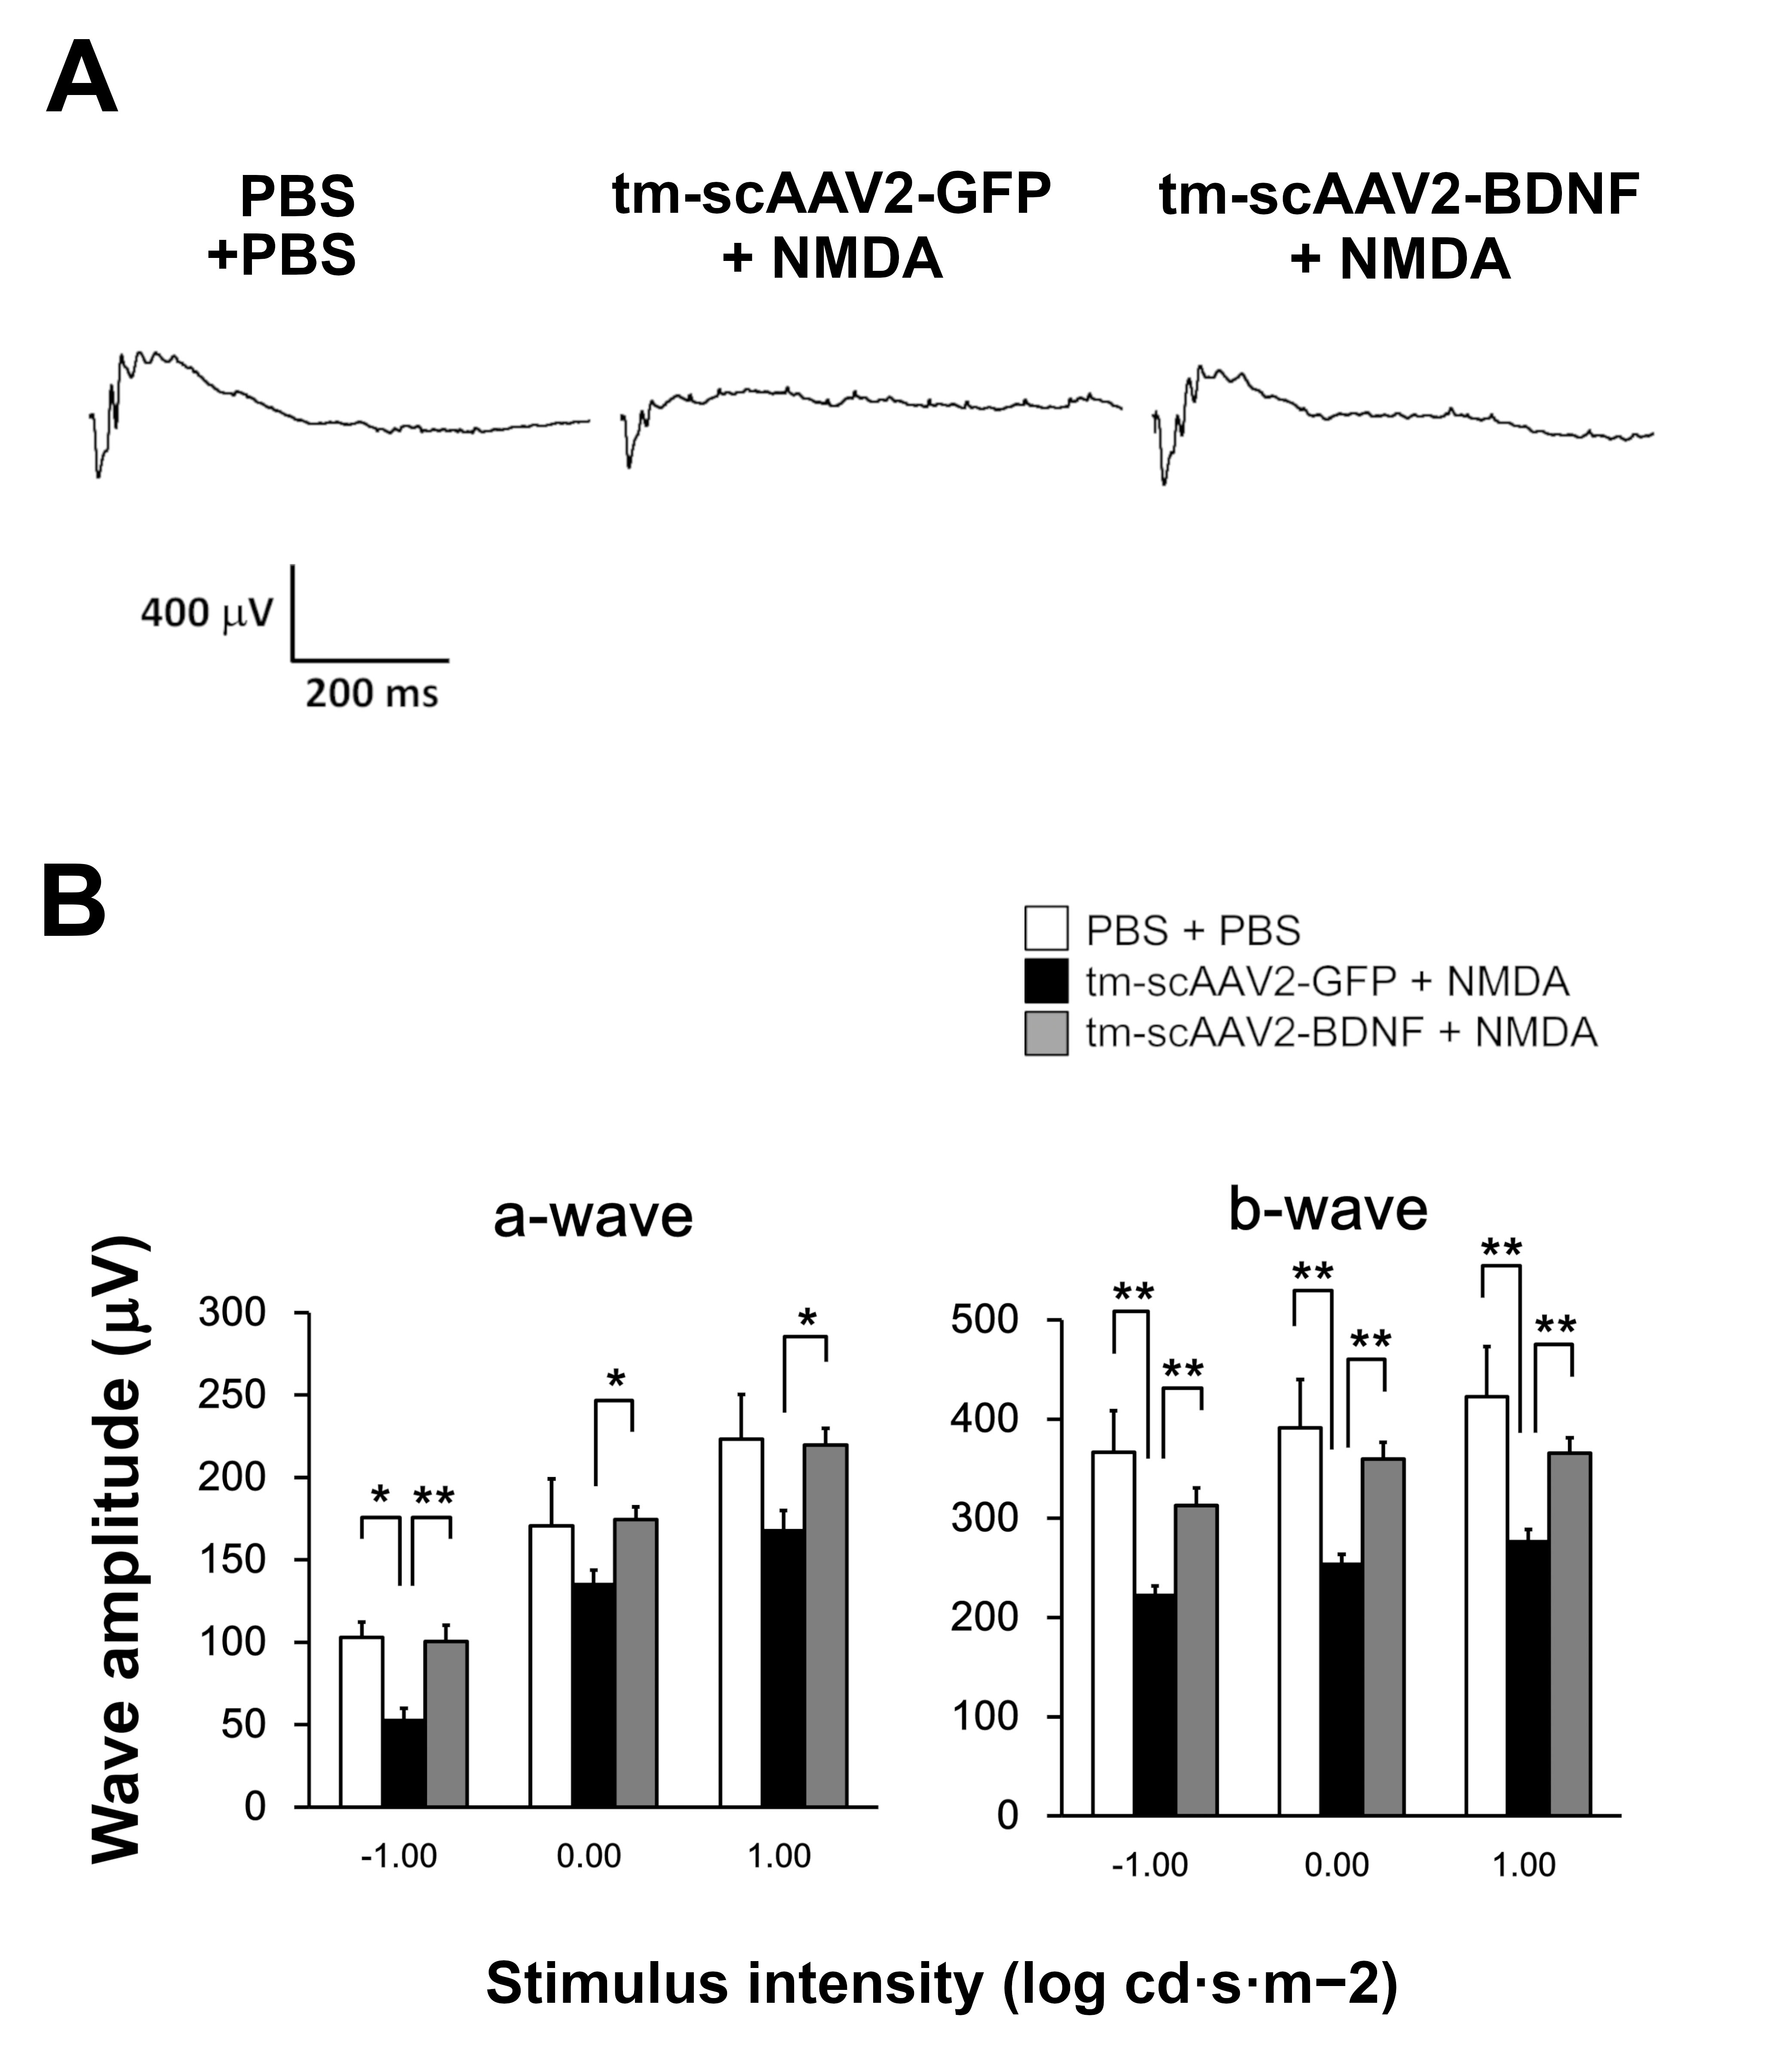
 Figure 4 of
Shiozawa, Mol Vis 2020; 26:409-422.
Figure 4 of
Shiozawa, Mol Vis 2020; 26:409-422.