Figure 2. Histological analysis. A: Exemplary images of hematoxylin and eosin-stained cross sections obtained from the buffer-treated (left), control vector-NMDA-treated
(middle), and therapeutic vector-NMDA-treated (right) groups. Images were captured at a distance of 1,000 μm from the ONH.
Scale bar represents 50 μm. GCL: ganglion cell layer, IPL: inner plexiform layer, INL: inner nuclear layer. B: Comparison of inner retinal thickness at individual points that were 250 µm from the ONH in the three groups (buffer only,
n = 6; control vector-NMDA, n = 6; therapeutic vector-NMDA, n = 9, *p<0.05 in SNK test).
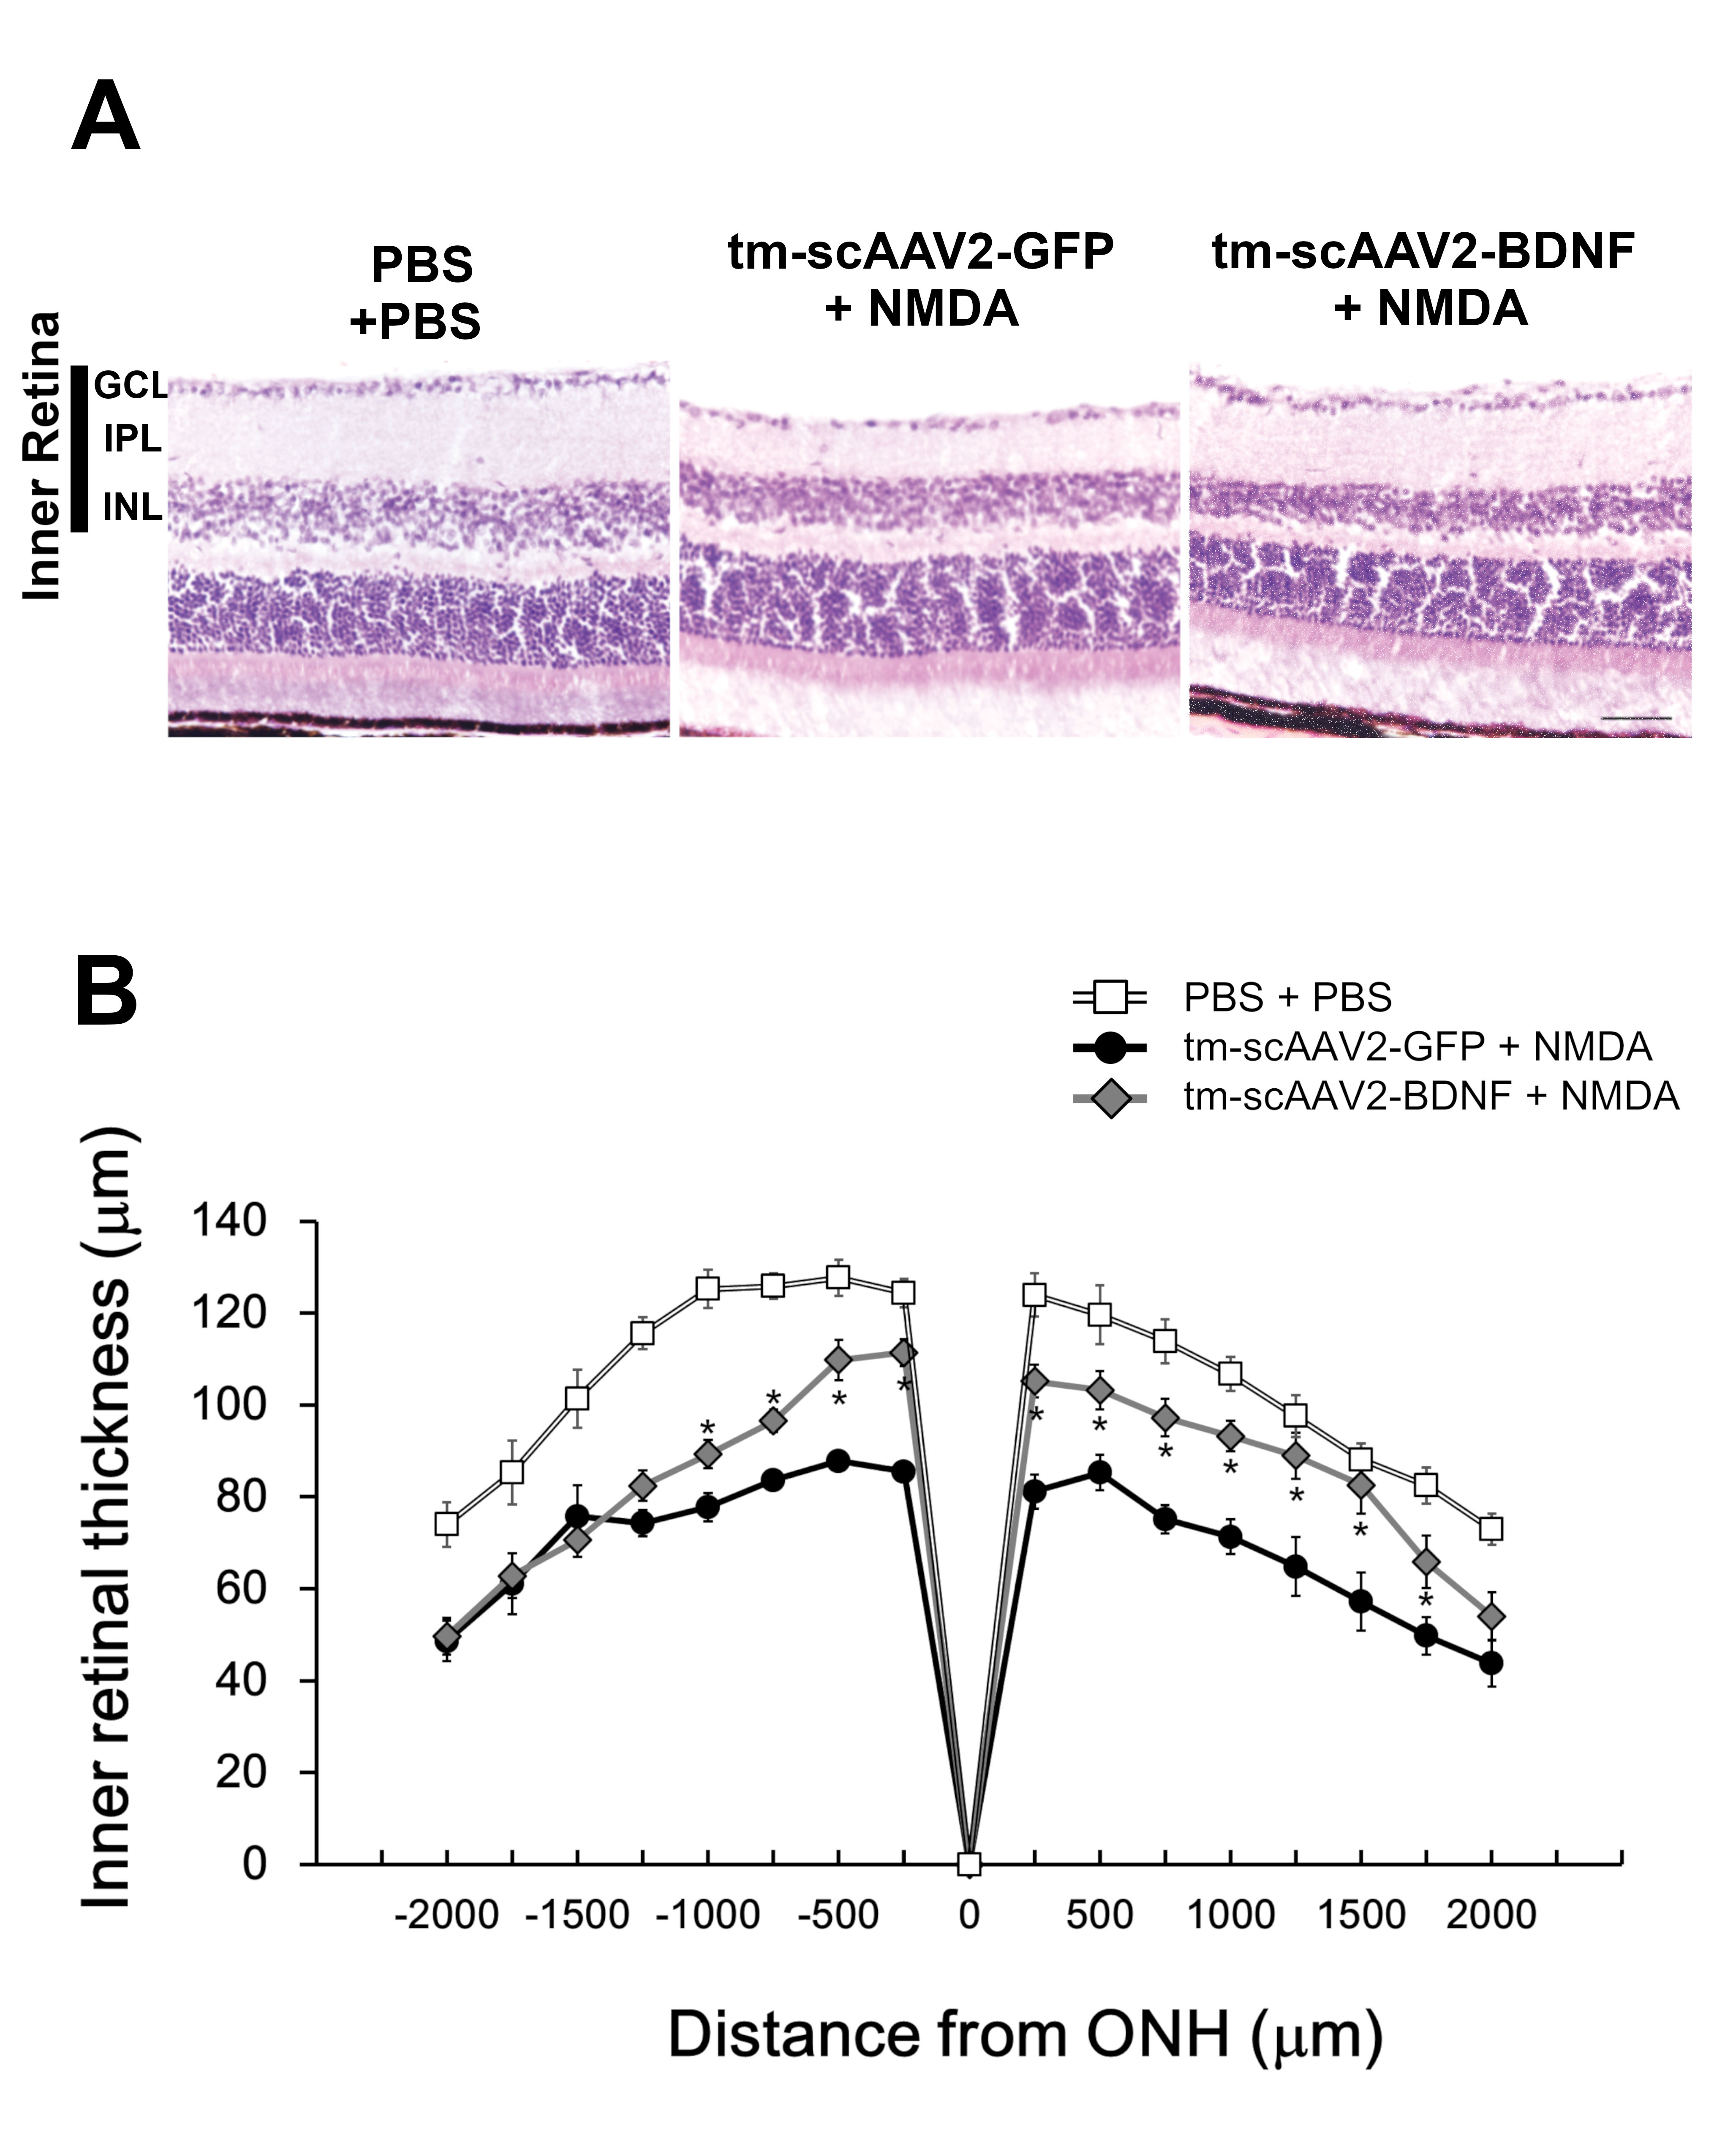
 Figure 2 of
Shiozawa, Mol Vis 2020; 26:409-422.
Figure 2 of
Shiozawa, Mol Vis 2020; 26:409-422.