Figure 1. Retinal GFP and BDNF expression after intravitreal injection of tm-scAAV2-GFP and tm-scAAV2-BDNF. A: Fluorescence microscopic images of cross sections treated with tm-scAAV2-GFP and NMDA. Green: GFP, Blue: DAPI. Scale bar
represents 50 μm. B: Relative RNA expression levels of BDNF analyzed by the comparative threshold cycle method. GAPDH was used to normalize gene
expressions (n = 6 in each group, *p<0.05 for a two-tailed Mann–Whitney U test). C: Protein expression levels of BDNF after intravitreal injection of tm-scAAV2-BDNF, as analyzed by ELISA (n = 4 in each group,
*p<0.05 for a two-tailed Mann–Whitney U test).
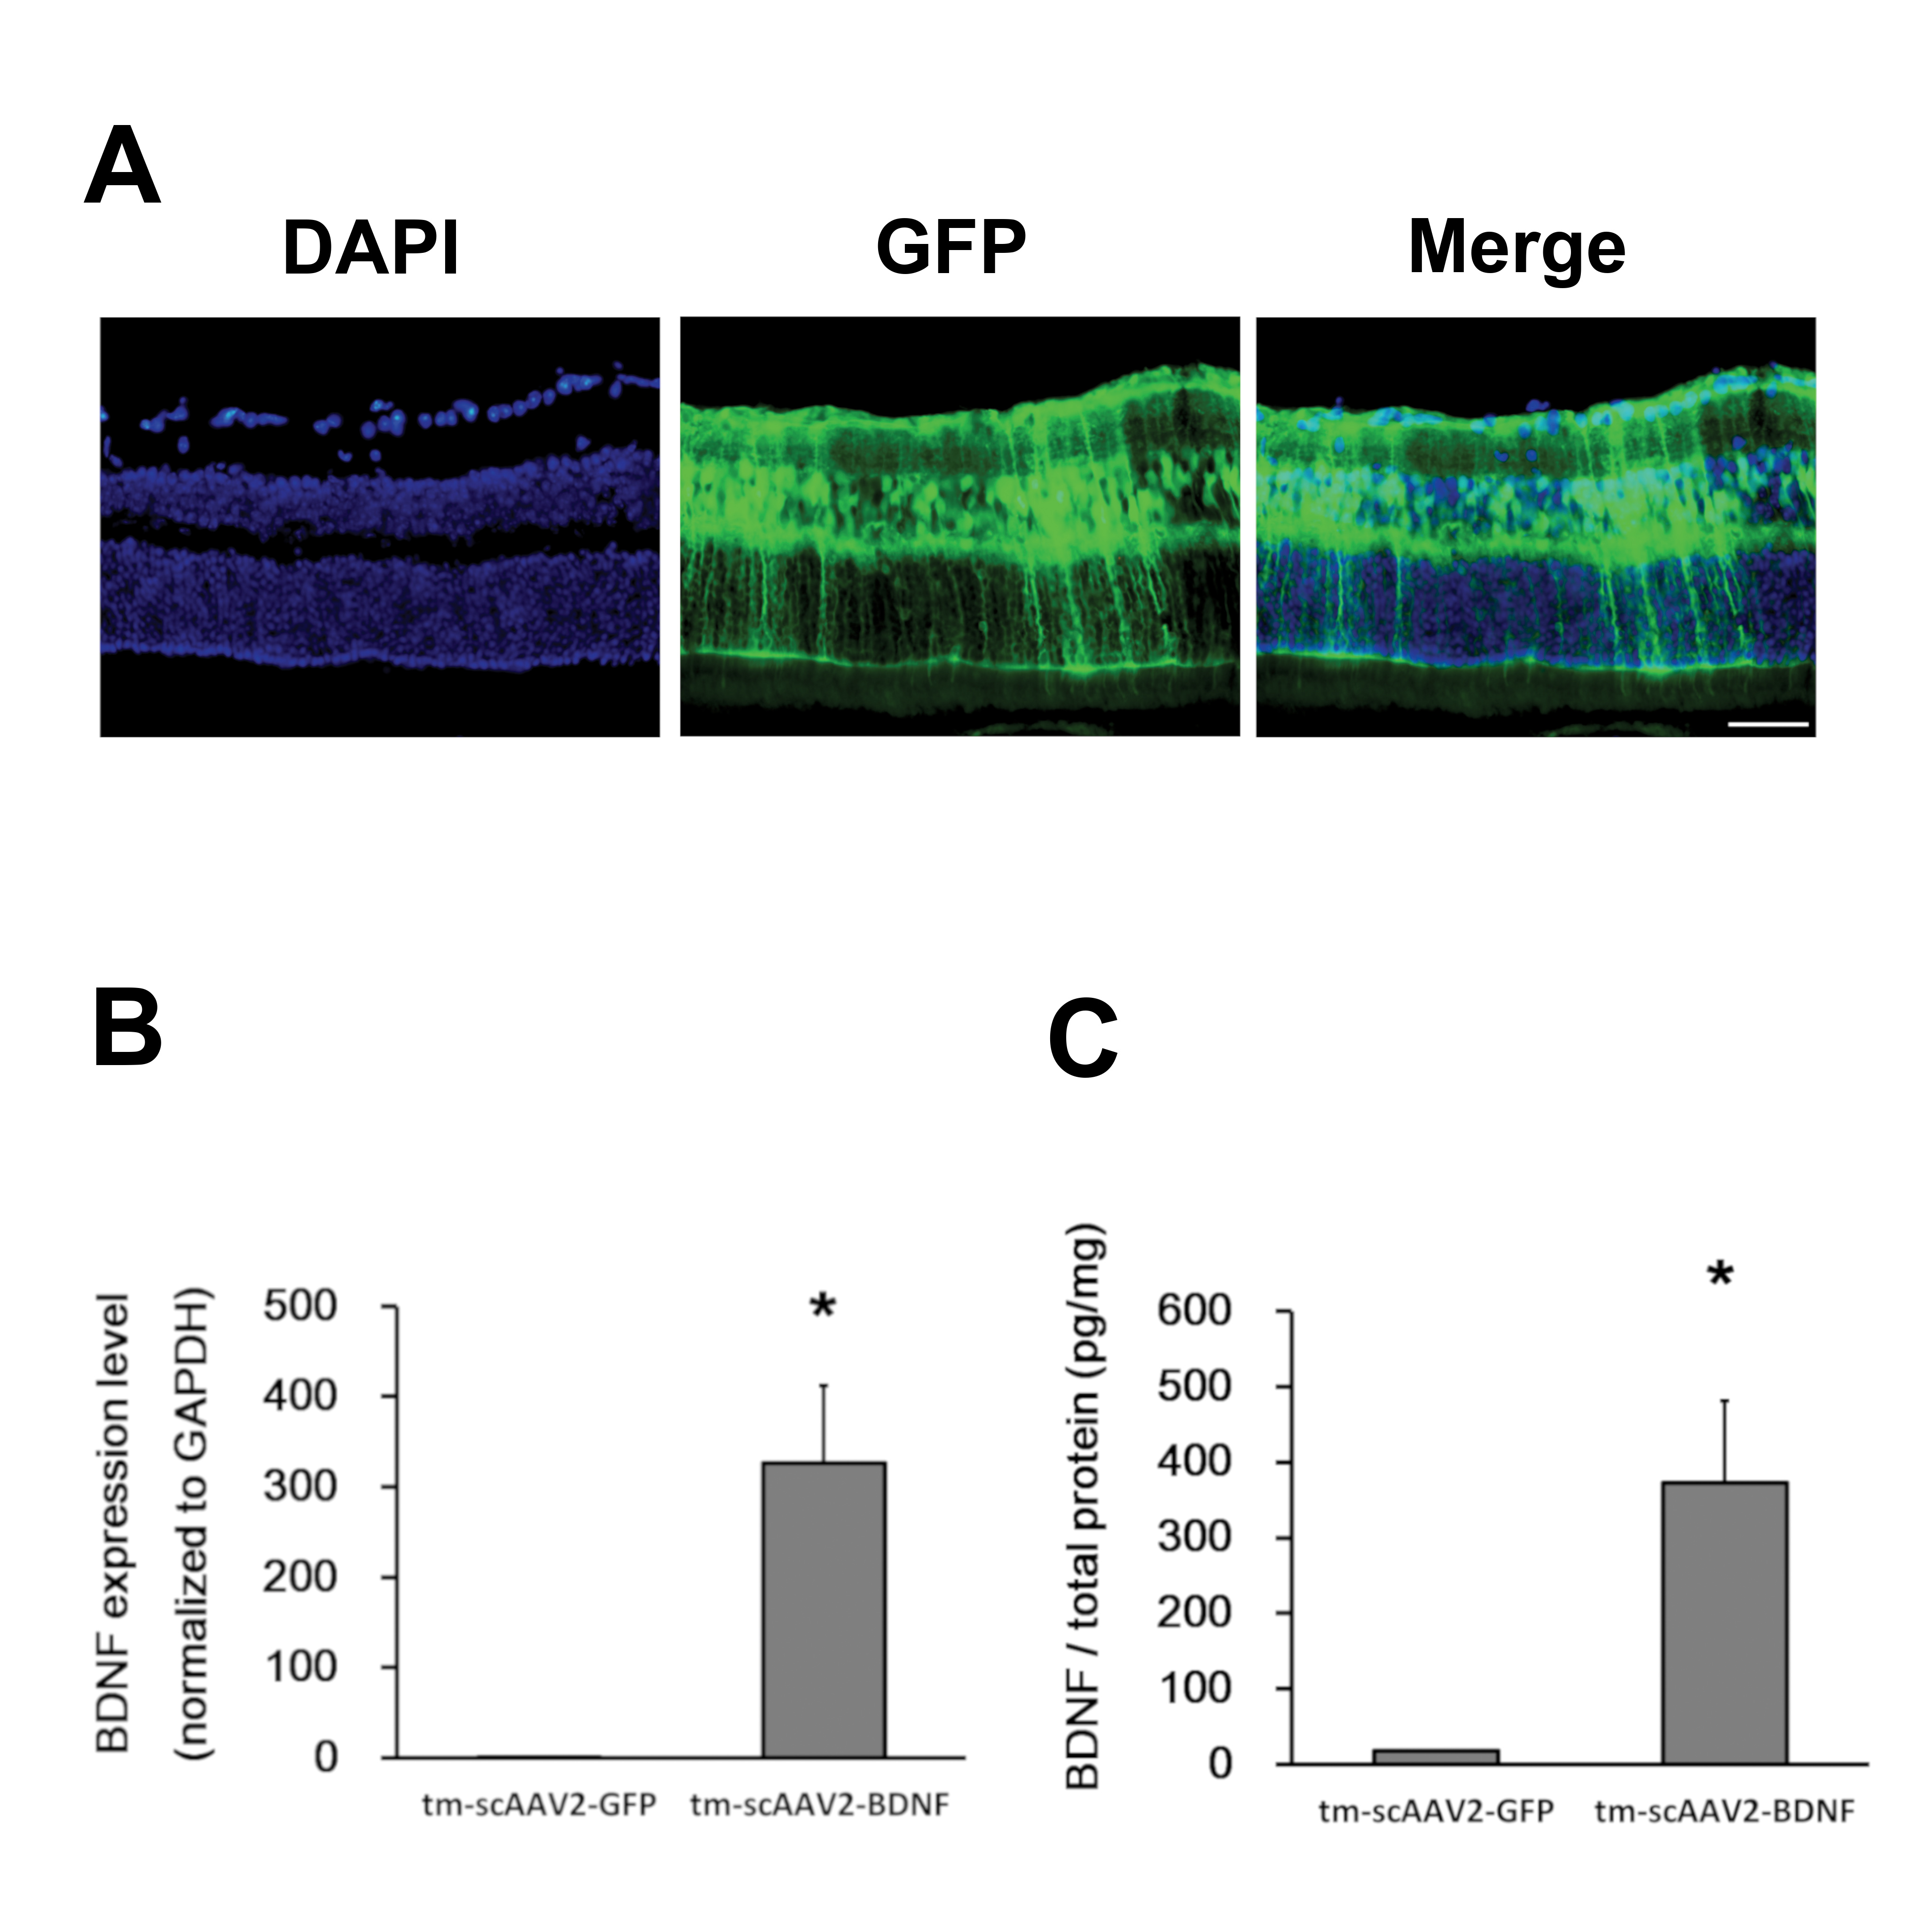
 Figure 1 of
Shiozawa, Mol Vis 2020; 26:409-422.
Figure 1 of
Shiozawa, Mol Vis 2020; 26:409-422.