Figure 9. Effect of MgAT on NMDA-induced changes in retinal gene expression of (A) CaMKIIα (B) CaMKIIβ (C) CaMKIIδ and (D) CaMKIIγ at 3-, 6-, 24-h and 7 days post-treatment. Group 1 was injected with PBS, group 2 was injected with NMDA and group
3 was injected with MgAT 24 hour before the injection of NMDA. *p<0.05 versus group 1, **p<0.01 versus group 1, ***p<0.001
versus group 1, #p<0.05 versus group 2, ###p<0.001 versus group 2. N=3 for each time point.
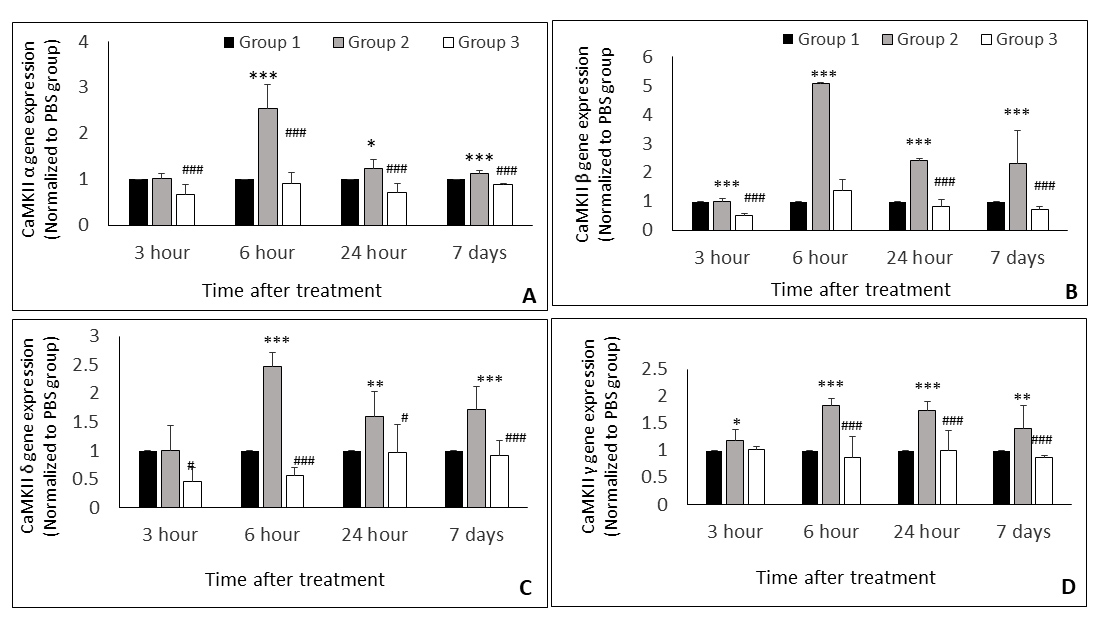
 Figure 9 of
Jafri, Mol Vis 2020; 26:392-408.
Figure 9 of
Jafri, Mol Vis 2020; 26:392-408.