Figure 6. Effect of MgAT pre-treatment on NMDA-induced changes in the retinal cabin-1 expression. A: Cabin-1 and β actin bands obtained from Western blot at 3-, 6-, 24-h and 7 days post-treatment. B: The densitometric analysis of Western blot bands (i) 3 h after treatment (ii) 6 h after treatment (iii) 24 h after treatment
(iv) 7 days after treatment.. Group 1 was injected with PBS, group 2 was injected with NMDA and group 3 was injected with
MgAT 24 h before the injection of NMDA. *p<0.05 to group 1, **p<0.01 to group 1, #p<0.05 to group 2. N=3 for each time point.
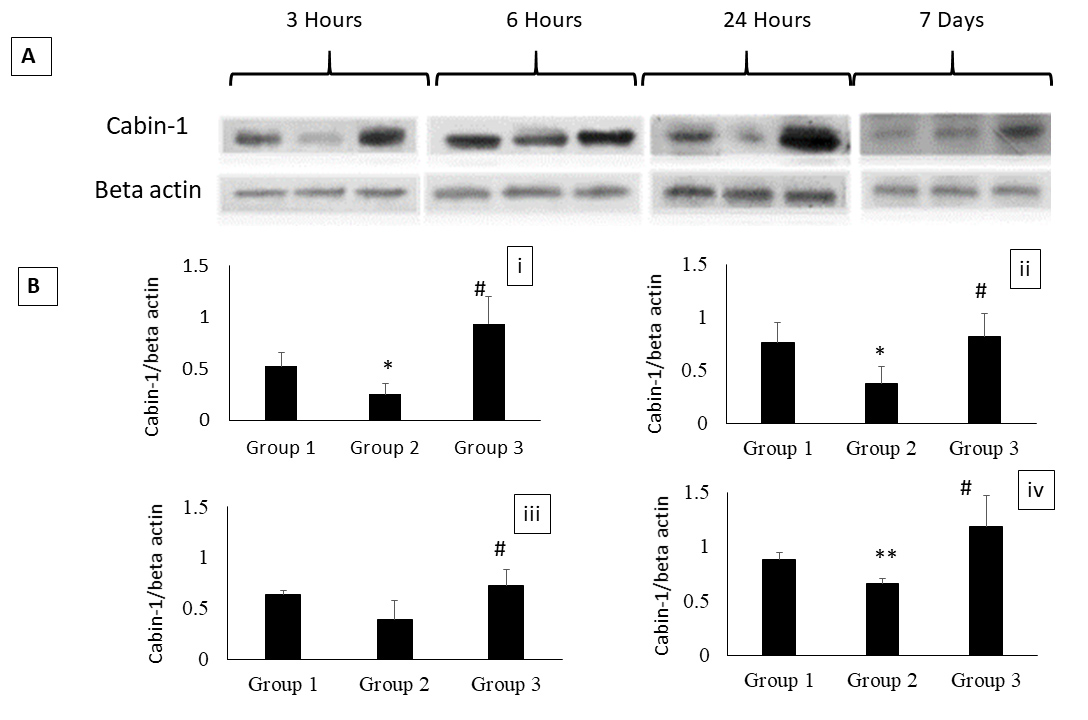
 Figure 6 of
Jafri, Mol Vis 2020; 26:392-408.
Figure 6 of
Jafri, Mol Vis 2020; 26:392-408.