Figure 10. Effect of MgAT on NMDA-induced changes in RGC survival. A: Photomicrographs Showing the Brn3A staining of retinal sections (20X). Dark brown cells represent Brn3A positive cells indicating
live RGCs (indicated by arrows). B: Quantitative estimation of the Brn3A positive cells (n=6). C: Retinal flatmounts showing fluorogold stained RGCs. D: Quantitative estimation of the density of fluroglod positive cells (n=6). Group 1 was injected with PBS, group 2 was injected
with NMDA and group 3 was injected with MgAT 24 hour before the injection of NMDA. NMDA: N-methyl-D-aspartic acid, MgAT: Magnesium
Acetyltaurate, GCL: Ganglion cell layer. **p<0.01 versus group 1, ***p<0.001 versus group 1; ##<0.01 versus group 2; ###<0.001
versus group 2. (n=6).
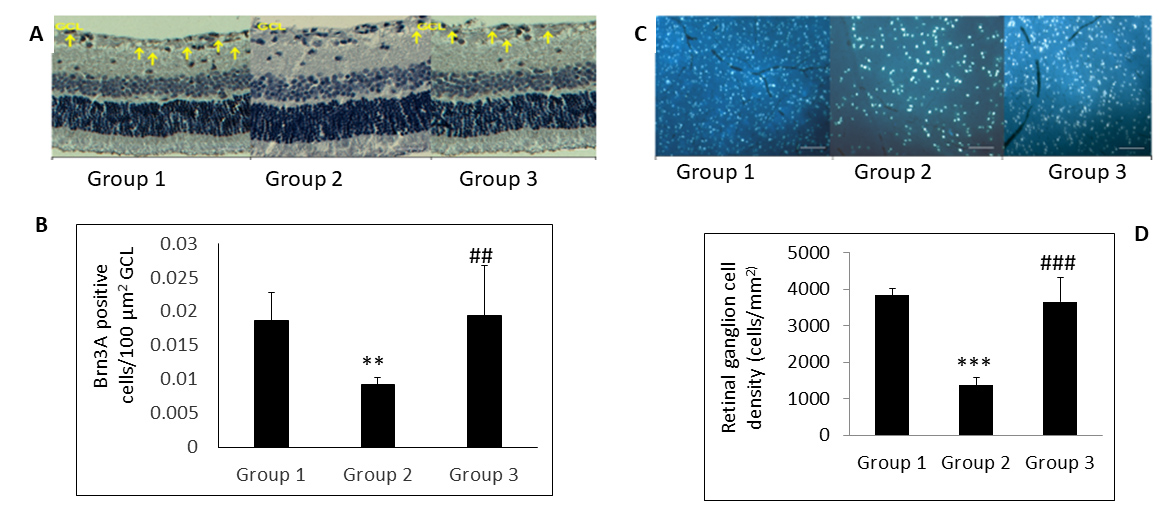
 Figure 10 of
Jafri, Mol Vis 2020; 26:392-408.
Figure 10 of
Jafri, Mol Vis 2020; 26:392-408.