Figure 1. The cytokine profile in the tears of all subjects. IL-1 β, IL-2, IL-6, IL-17, IFN- γ, and TNF- α increased dramatically in
the C-DESOS and G-DESOS groups compared to the CMDE and control groups (p=0.0141). However, they all sharply decreased in
the G-DESOS group after glucocorticoid treatment on Day 30 but not in the C-DESOS group. There were no significant differences
in IL-10 among the groups (p=0.1502).
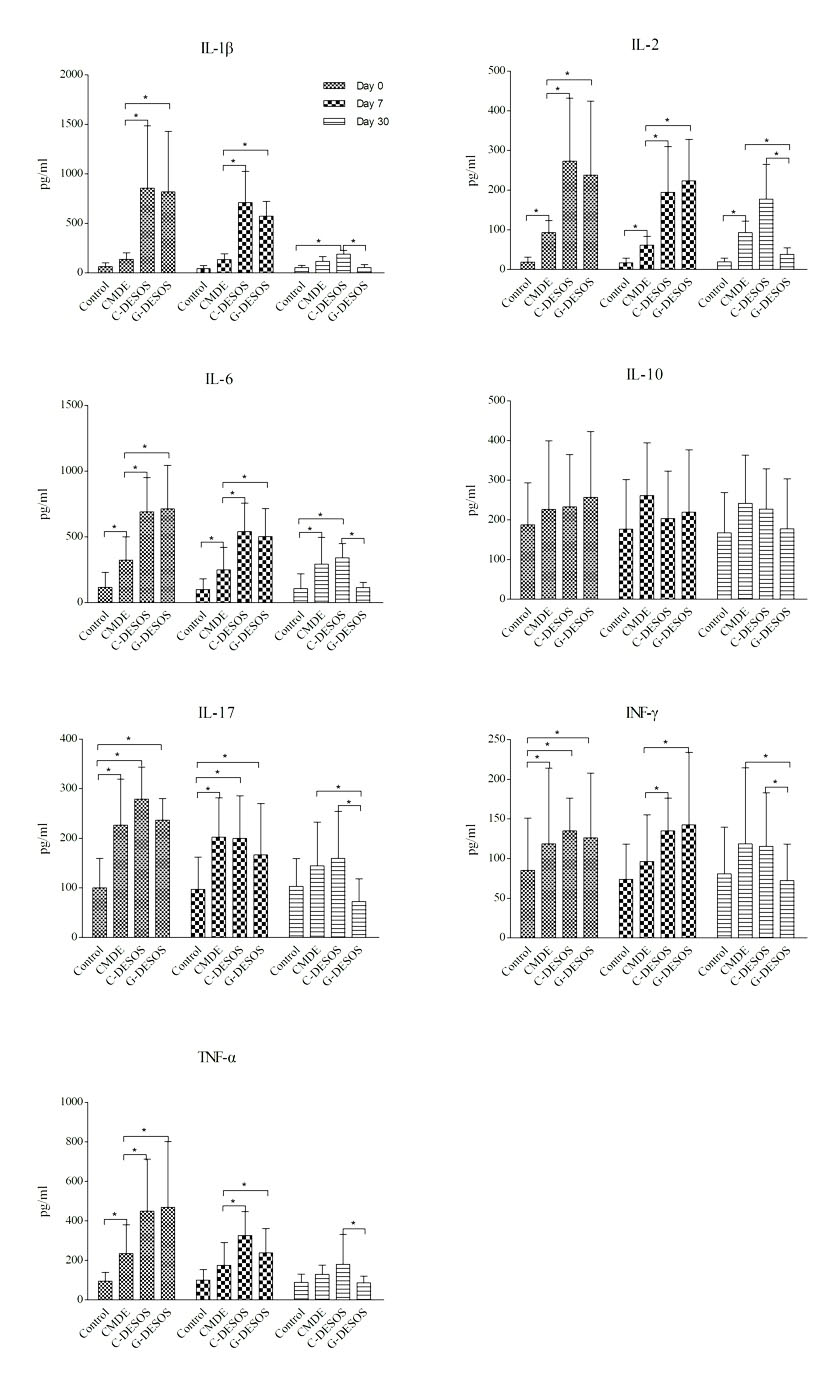
 Figure 1 of
Li, Mol Vis 2020; 26:359-369.
Figure 1 of
Li, Mol Vis 2020; 26:359-369.