Figure 2 of
Schmidl, Mol Vis 2020; 26:326-333.
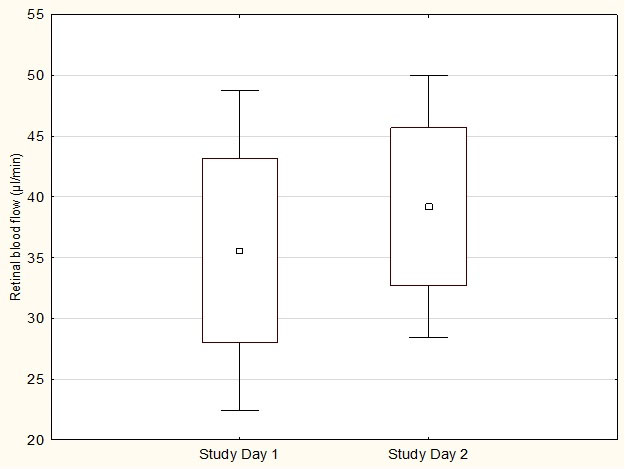
Figure 2.
Total retinal blood flow on both study days. Data are presented as mean ± 0.95 CI ± SD, n=13.
 Figure 2 of
Schmidl, Mol Vis 2020; 26:326-333. Figure 2 of
Schmidl, Mol Vis 2020; 26:326-333.
Figure 2 of
Schmidl, Mol Vis 2020; 26:326-333. Figure 2 of
Schmidl, Mol Vis 2020; 26:326-333.