Figure 1 of
Schmidl, Mol Vis 2020; 26:326-333.
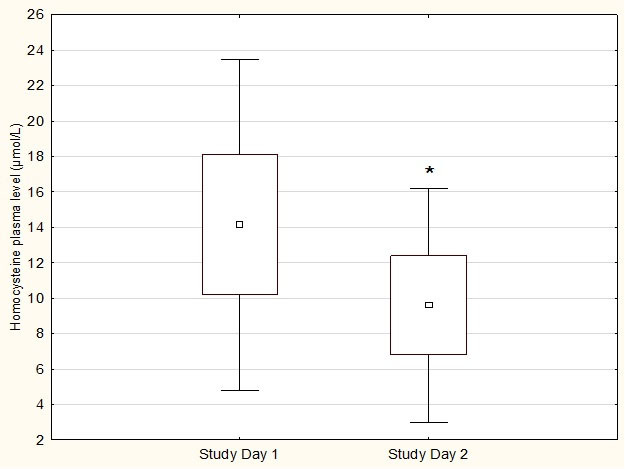
Figure 1.
Plasma Hcy levels on both study days. * Significant on study day 2 vs. study day 1 (p<0.001). Data are presented as mean ± 0.95 CI ± SD (n=24).
 Figure 1 of
Schmidl, Mol Vis 2020; 26:326-333.
Figure 1 of
Schmidl, Mol Vis 2020; 26:326-333.