Figure 8. Immunofluorescence staining for CHOP in the rat retina. A: Representative images of immunofluorescence staining for CHOP (red, indicated by white arrows), counterstained with 4′,
6-diamidino-2-phenylin-dole (DAPI; blue) for cellular nuclei. Magnification = 400X. Scale bar = 50 µm. B: Quantification of CHOP staining. Data are mean ± standard error of the mean (SEM, n=3). C, control; D, diabetes; D+B12,
diabetic rats treated with vitamin B12. *Significant difference from the control group; #significant difference from the diabetes group (p<0.05).
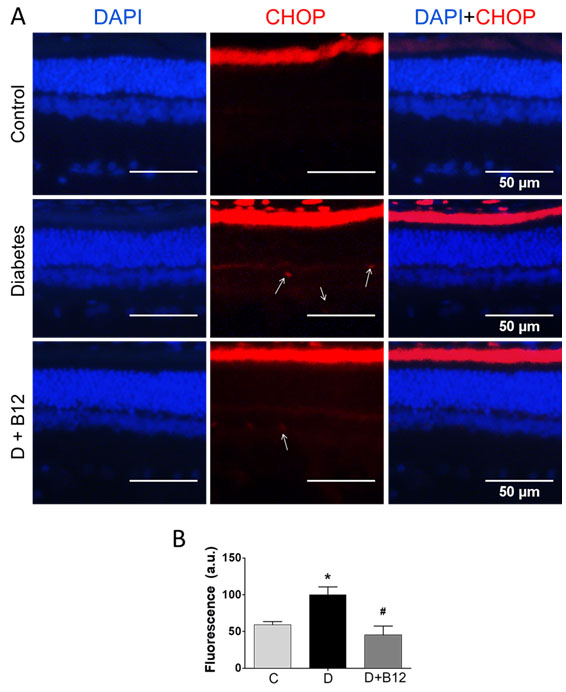
 Figure 8 of
Reddy, Mol Vis 2020; 26:311-325.
Figure 8 of
Reddy, Mol Vis 2020; 26:311-325.