Figure 5. Immunoblotting for HIF1α and VEGF in the rat retina. A: Representative immunoblots for HIF1α and VEGF. B: Quantification of the corresponding densitometry data. The protein expression was normalized to the tubulin and was represented
as %control. Data are mean ± standard error of the mean (SEM, n=3). C, control; D, diabetes; D+B12, diabetic rats treated
with vitamin B12. *Significant difference from the control group; #significant difference from the diabetes group (p<0.05).
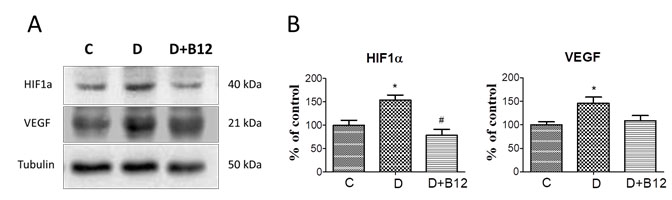
 Figure 5 of
Reddy, Mol Vis 2020; 26:311-325.
Figure 5 of
Reddy, Mol Vis 2020; 26:311-325.