Figure 2. Retinal morphology and thickness. A: Representative images of hematoxylin and eosin (H&E) staining on the rat retinal sections after the 4-month experimental
period. Magnification = 400X. Scale bar = 50 µm. B: Graphical representation of the retinal thickness of the rat (n = 4). Data are mean ± standard error of the mean (SEM).
C, control; D, diabetes; D+B12, diabetic rats treated with vitamin B12. *Significant difference from the control group; #significant difference from the diabetes group (p<0.05).
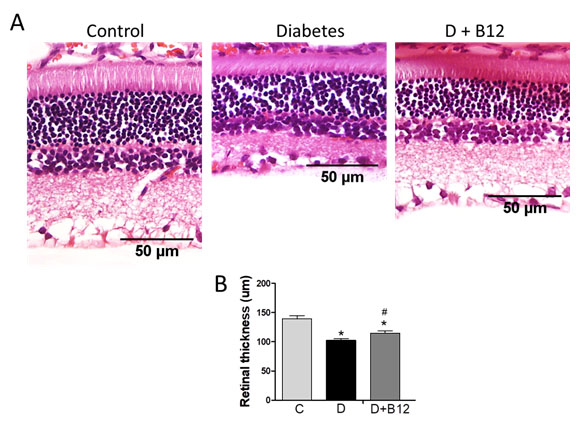
 Figure 2 of
Reddy, Mol Vis 2020; 26:311-325.
Figure 2 of
Reddy, Mol Vis 2020; 26:311-325.