Figure 4. Comparison of the age, visual acuity, and clinical characteristics of groups A and B. A: Scatter plot and regression line of visual acuity with age in group A (red filled circles) and group B (solid green pentagrams).
B: Bar chart of the clinical characteristics of the patients in groups A and B. Asterisks mark statistically significant differences
(p<0.05). The numbers on the top of each bar indicate numbers of eyes with different clinical features.
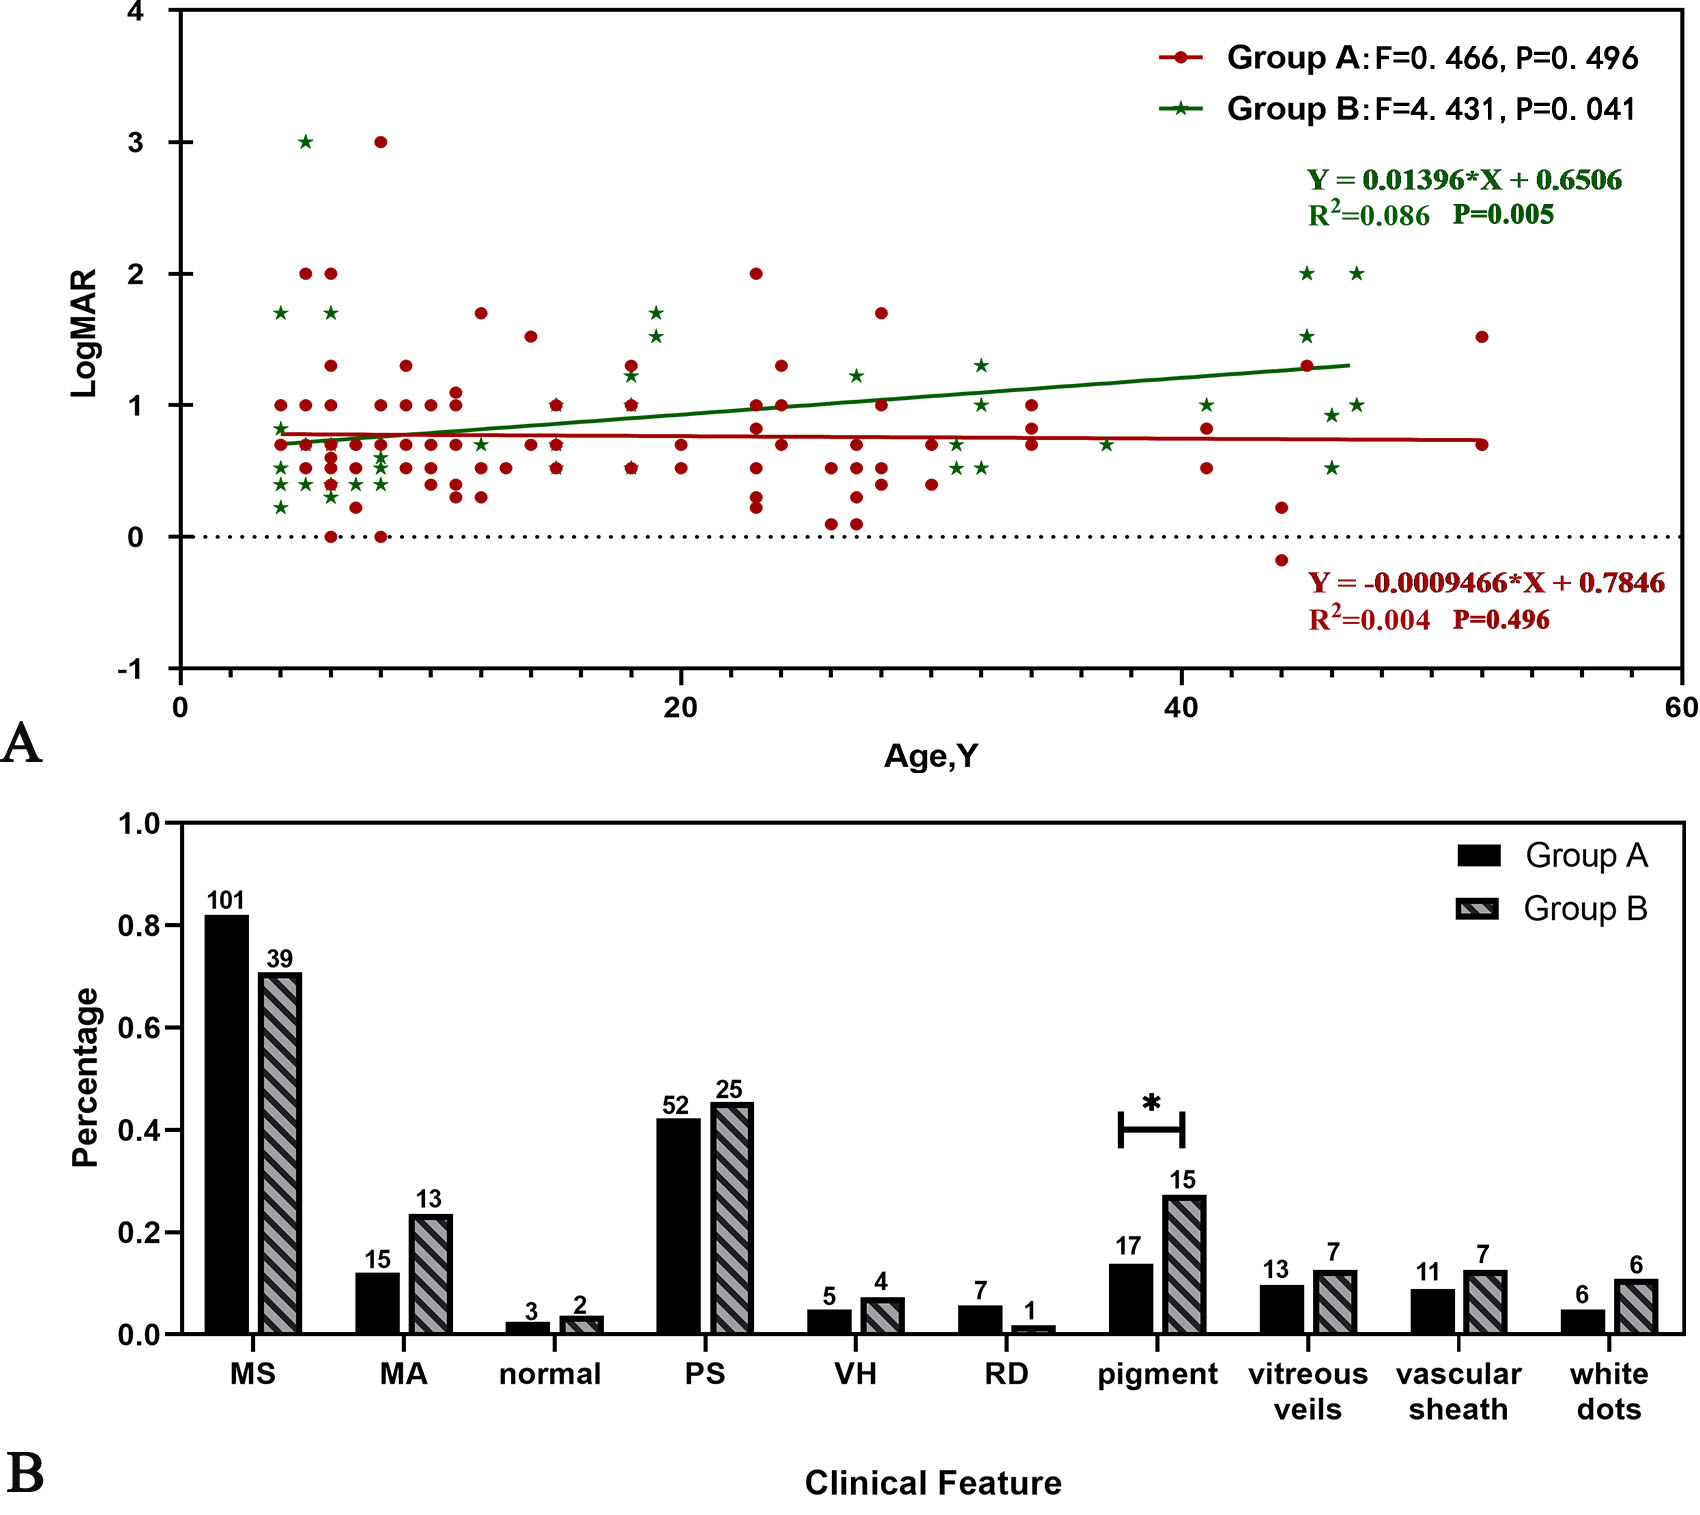
 Figure 4 of
Chen, Mol Vis 2020; 26:291-298.
Figure 4 of
Chen, Mol Vis 2020; 26:291-298.