Figure 1. The distribution of 68 distinct mutations of RS1 detected in our study and the breakpoints in two large deletions. A: The distribution of 68 mutations on exons of RS1. B: Lengths and positions of the two gross deletions of RS1 (in box with blue border). E indicates exon. Red squares indicate exons in coding regions. Black squares indicate exons in
non-coding regions, and thick black lines indicate introns and upstream or downstream non-coding regions. The blue numbers
indicate lengths of deletions in each corresponding region.
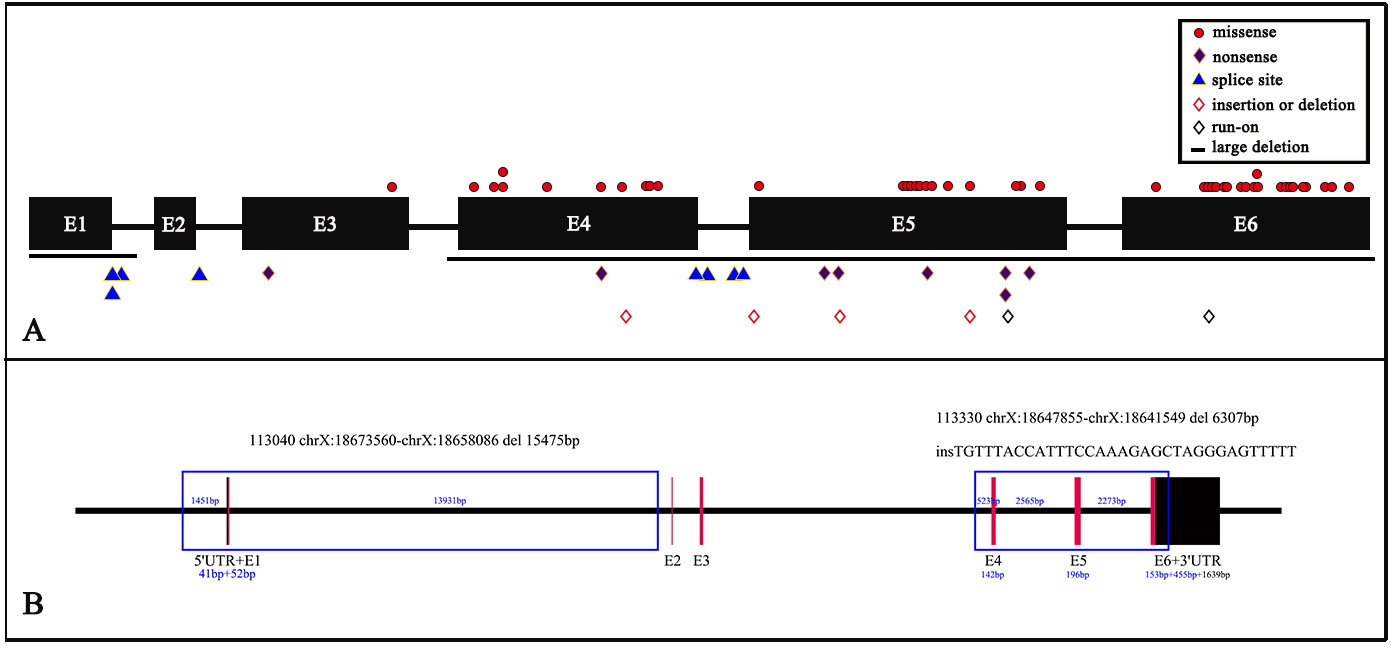
 Figure 1 of
Chen, Mol Vis 2020; 26:291-298.
Figure 1 of
Chen, Mol Vis 2020; 26:291-298.