Figure 6. Quantification of the relative changes in amino acid labeling. A, B: Glutamate. C, D: Glutamine. E, F: GABA. G, H: Glycine; (n = 4 for each group). A, C, E, G represent the relative changes in amino acid labeling in high glucose alone compared to control, whereas B, D, F, and H show the relative change in in amino acid labeling in the high glucose and proinflammatory cytokines condition compared to
the control retinas. Each value represents the mean difference in immunoreactivity relative to the control condition and is
presented as mean percentage change ± standard error of the mean. One-way analysis of variance (ANOVA) followed by post-hoc
Dunnett’s multiple comparison test was used to determine significance. *p<0.05. Abbreviations: AC, amacrine cell; BC, bipolar
cell; GCL, ganglion cell layer; IPL, inner plexiform layer; IS, photoreceptor inner segments; MC, Müller cell; MCef, Müller
cell endfeet; ONL, outer nuclear layer; OPL, outer plexiform layer; OS, photoreceptor outer segments.
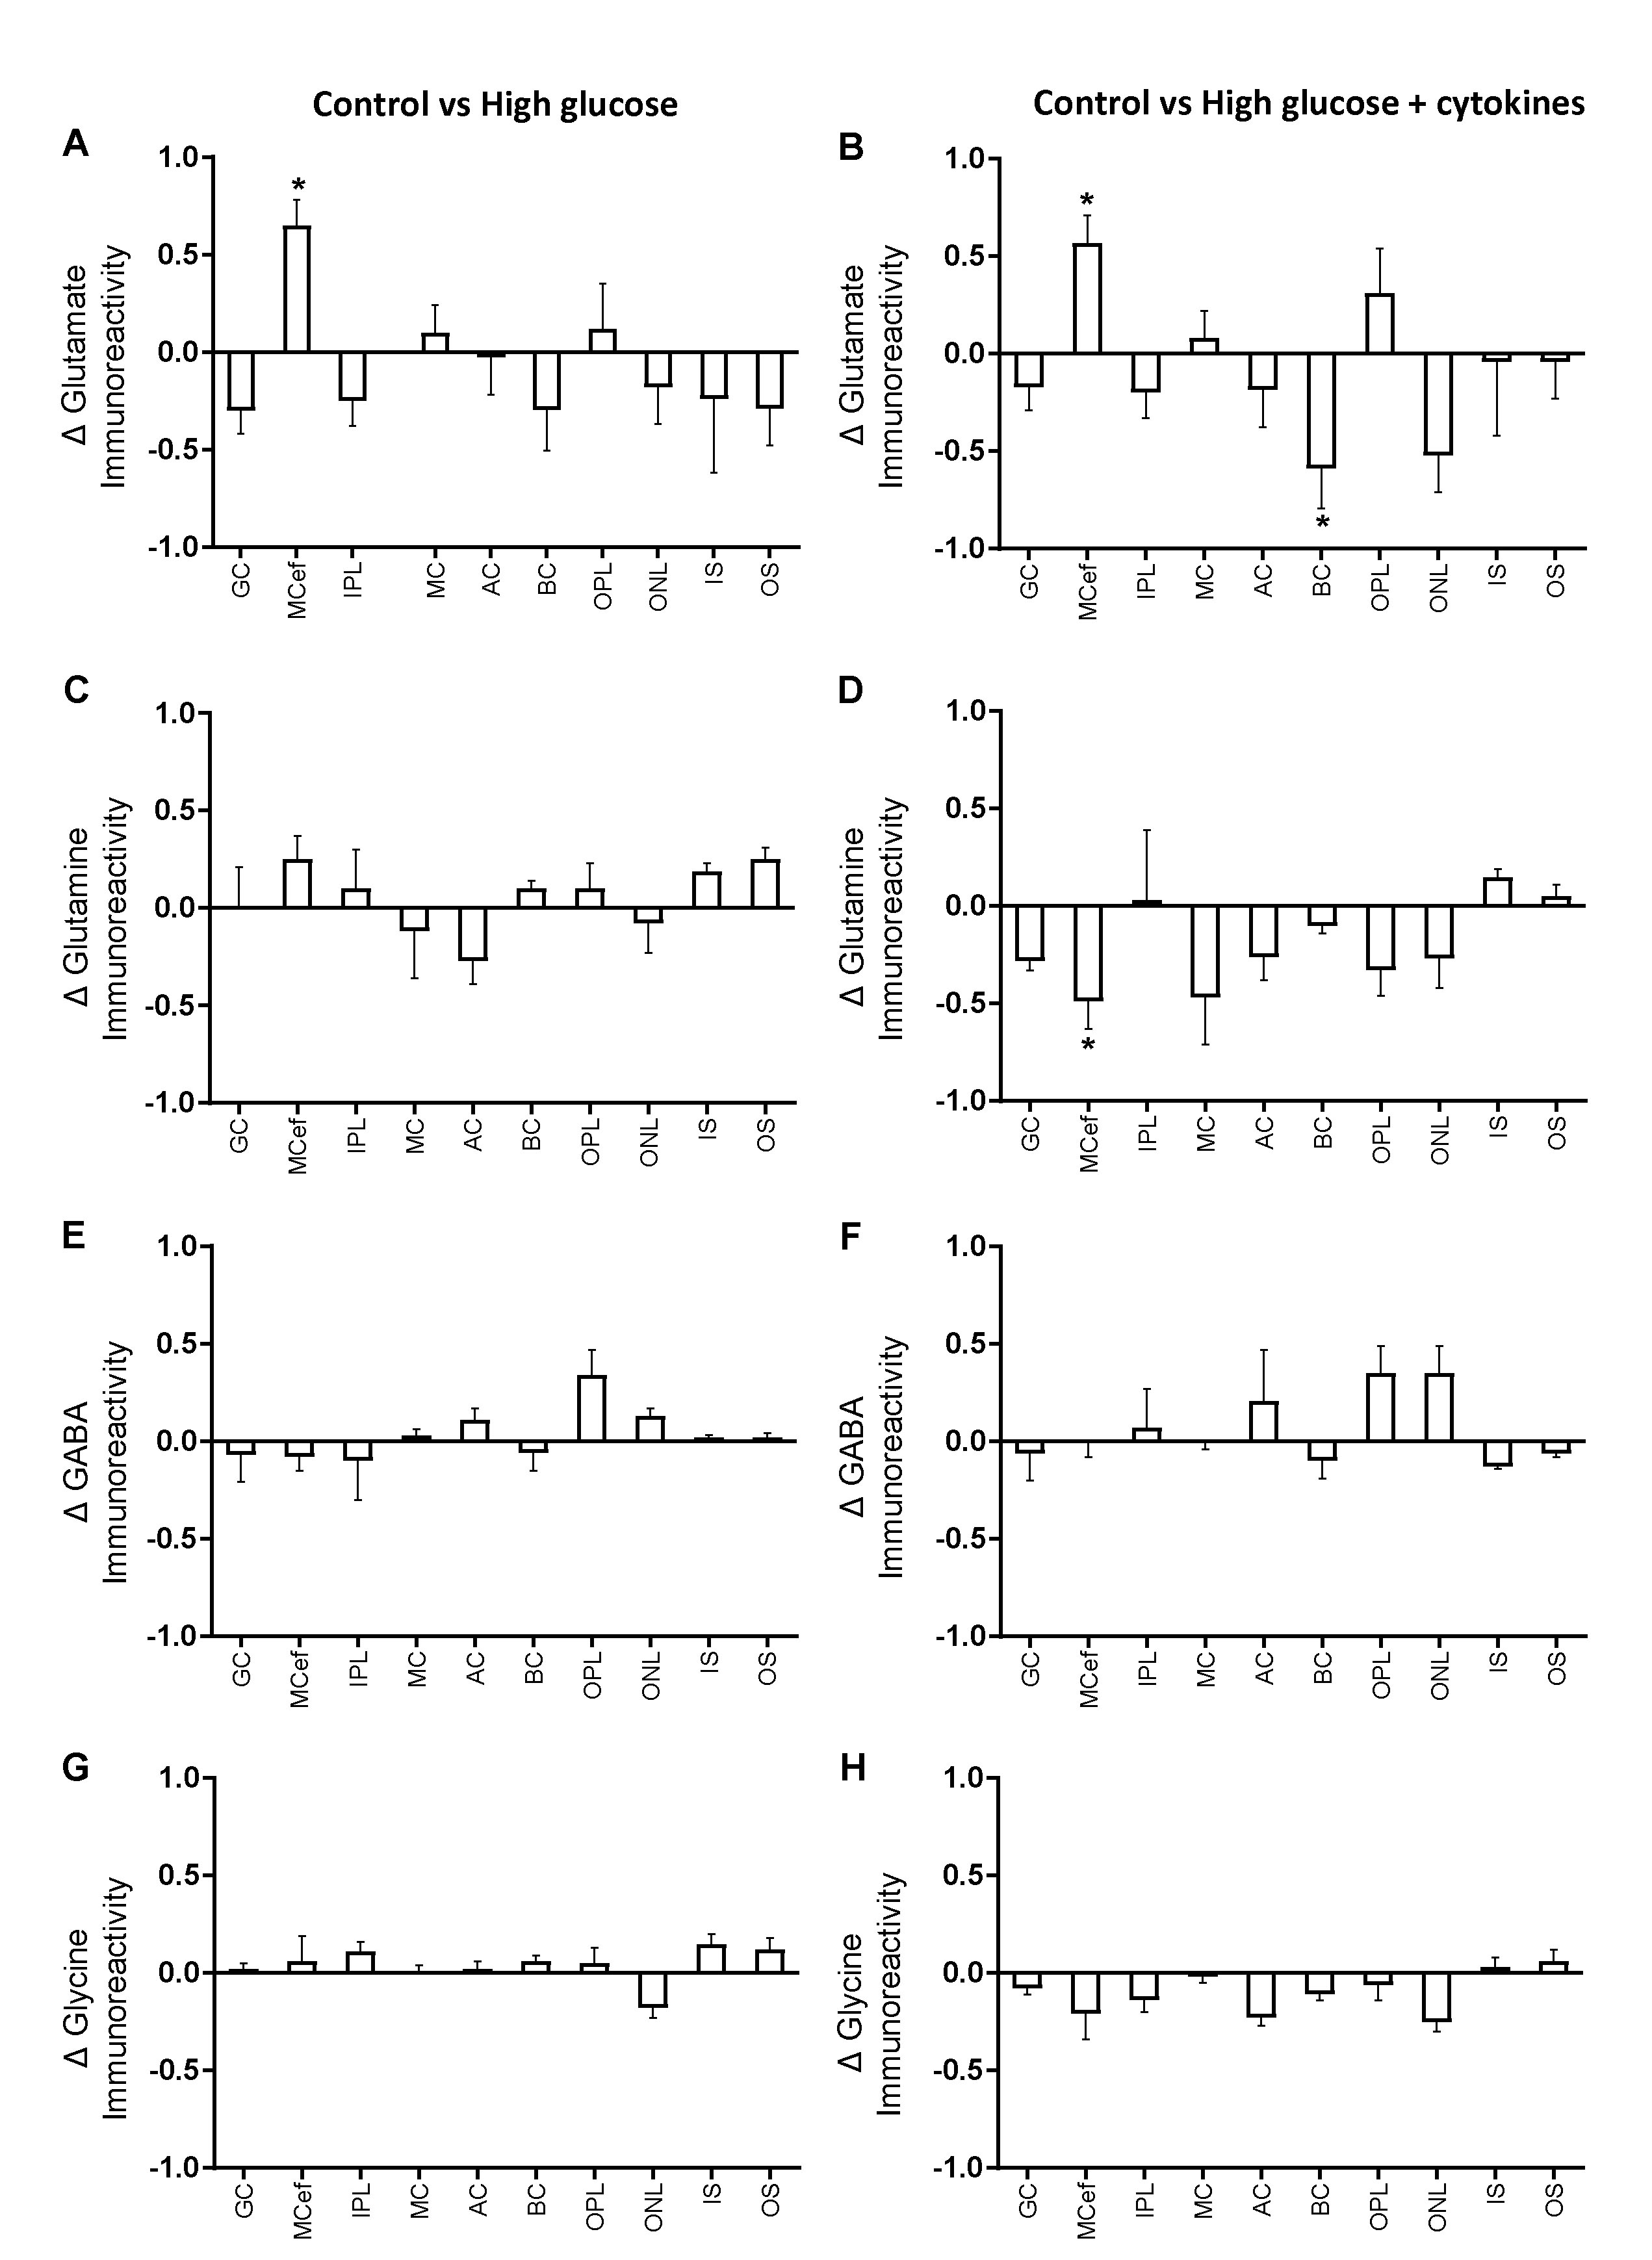
 Figure 6 of
Shivashankar, Mol Vis 2020; 26:277-290.
Figure 6 of
Shivashankar, Mol Vis 2020; 26:277-290.