Figure 4. Glutamate and glutamine levels in retina and incubation buffer. The glutamate and glutamine levels were measured from the
retinal explants and incubation buffer following short-term incubation. A: Glutamate levels in retinal explants and incubation buffer. B: The glutamate levels in the retinal explants and incubation buffer. The glutamate levels in the retinal explants exposed
to high glucose alone and in combination with proinflammatory cytokines was statistically significantly reduced relative to
control. The glutamate release from the retinal explants coexposed to high glucose and proinflammatory cytokines was statistically
significantly elevated. One-way analysis of variance (ANOVA) followed by post-hoc Dunnett’s multiple comparison test was used
to determine significance. *p<0.05, **p<0.01. Values represent mean ± standard error of the mean (n = 6–8 for each group).
Abbreviations: C, control; Cyt, proinflammatory cytokines; HG, high glucose; HG + Cyt, high glucose + proinflammatory cytokines.
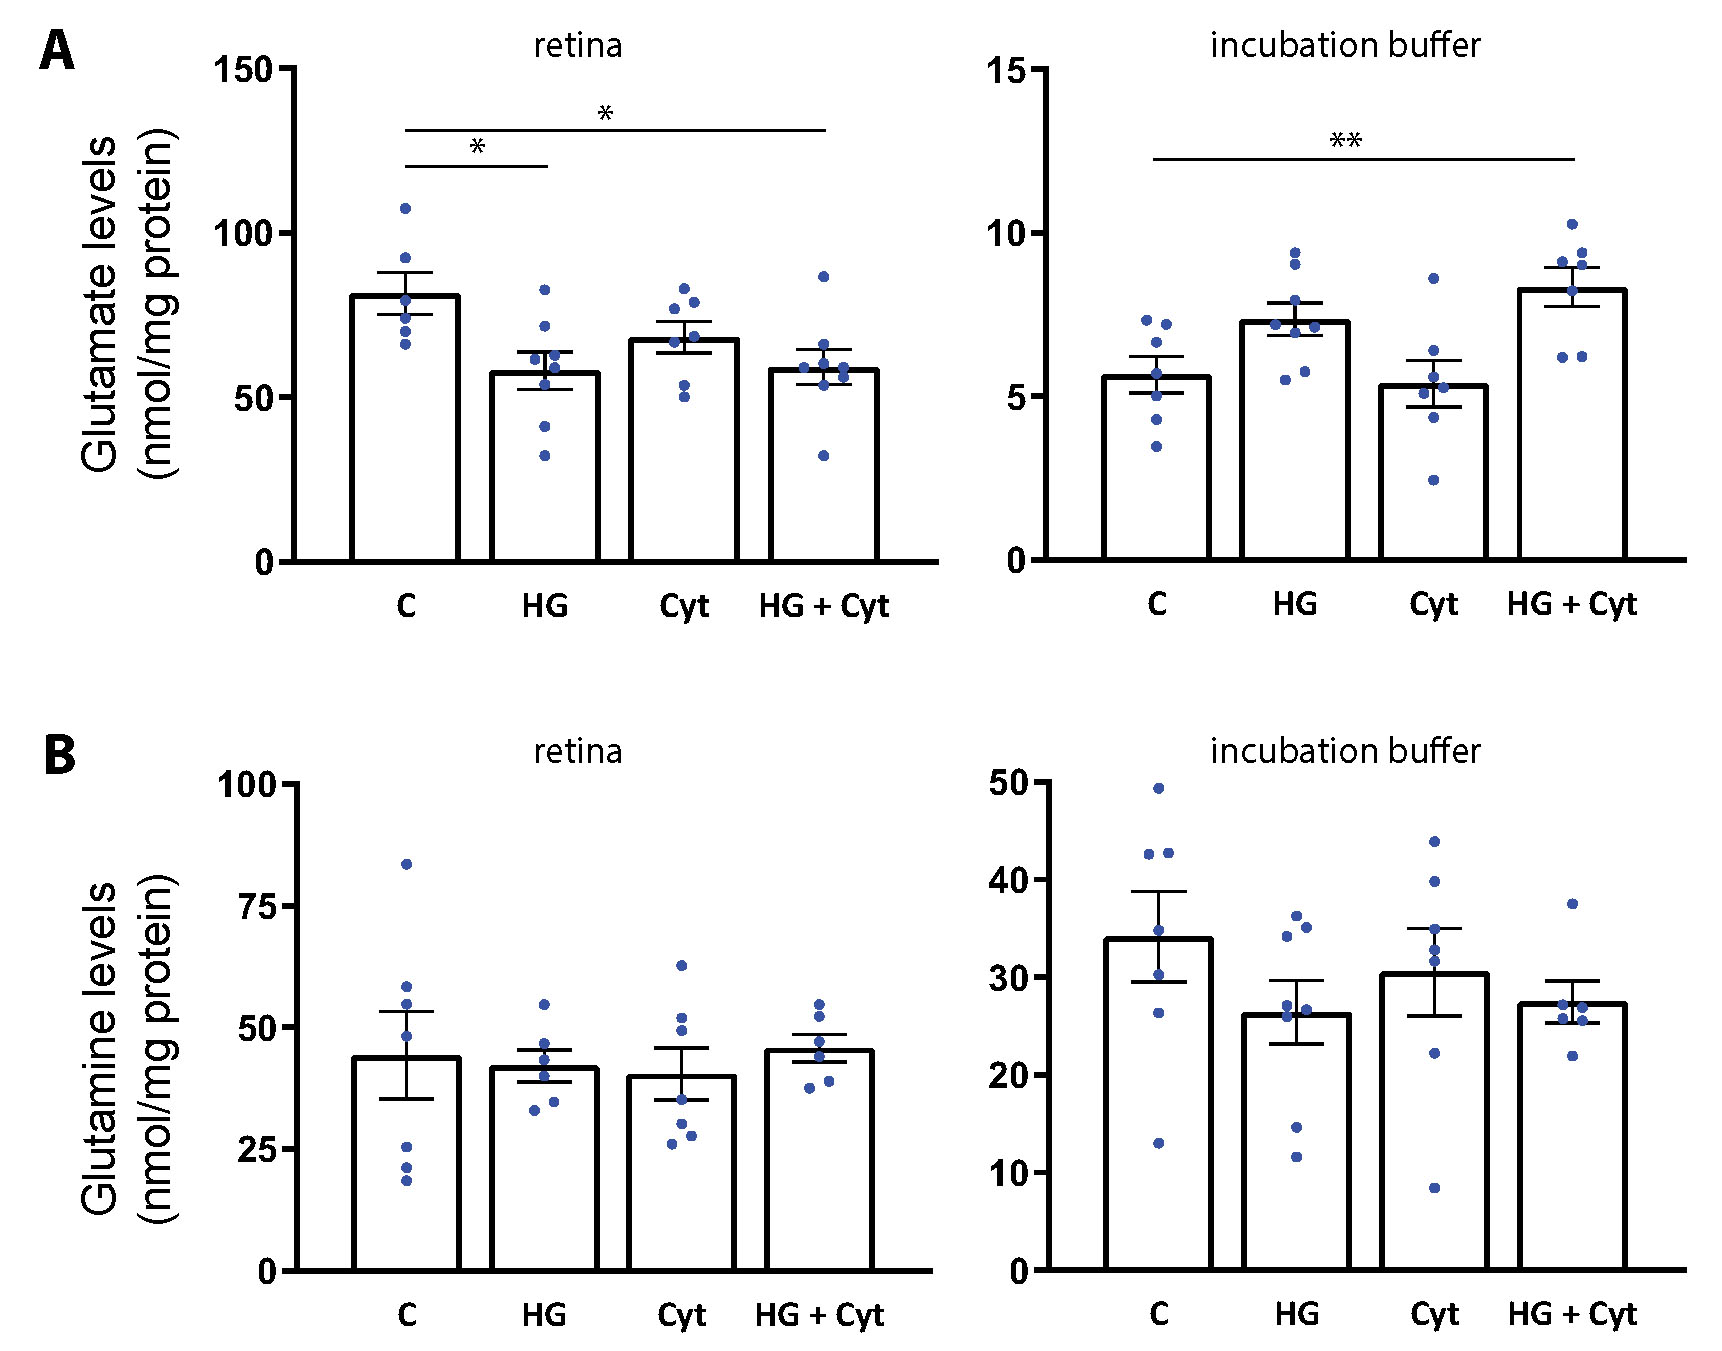
 Figure 4 of
Shivashankar, Mol Vis 2020; 26:277-290.
Figure 4 of
Shivashankar, Mol Vis 2020; 26:277-290.