Figure 2. Key energy metabolite levels in the retina and incubation buffer. The key metabolites of retinal energy metabolism were measured
in the retinal explants and incubation buffer following short-term incubation. A: Glucose levels in the retinal explants. B: Lactate levels in the retinal explants and incubation buffer. C: ATP levels in the retinal explants and incubation buffer. Coapplication of high glucose and proinflammatory cytokines caused
a statistically significant increase in the glucose, lactate, and ATP levels, in addition to increasing ATP release relative
to the control retinas. One-way analysis of variance (ANOVA) followed by post-hoc Dunnett’s multiple comparison test was used
to determine significance. Values represent mean ± standard error of the mean (n = 6–8 for each group). *p<0.05, **p<0.01.
Abbreviations: C, control; Cyt, proinflammatory cytokines; HG, high glucose; HG + Cyt, high glucose + proinflammatory cytokines.
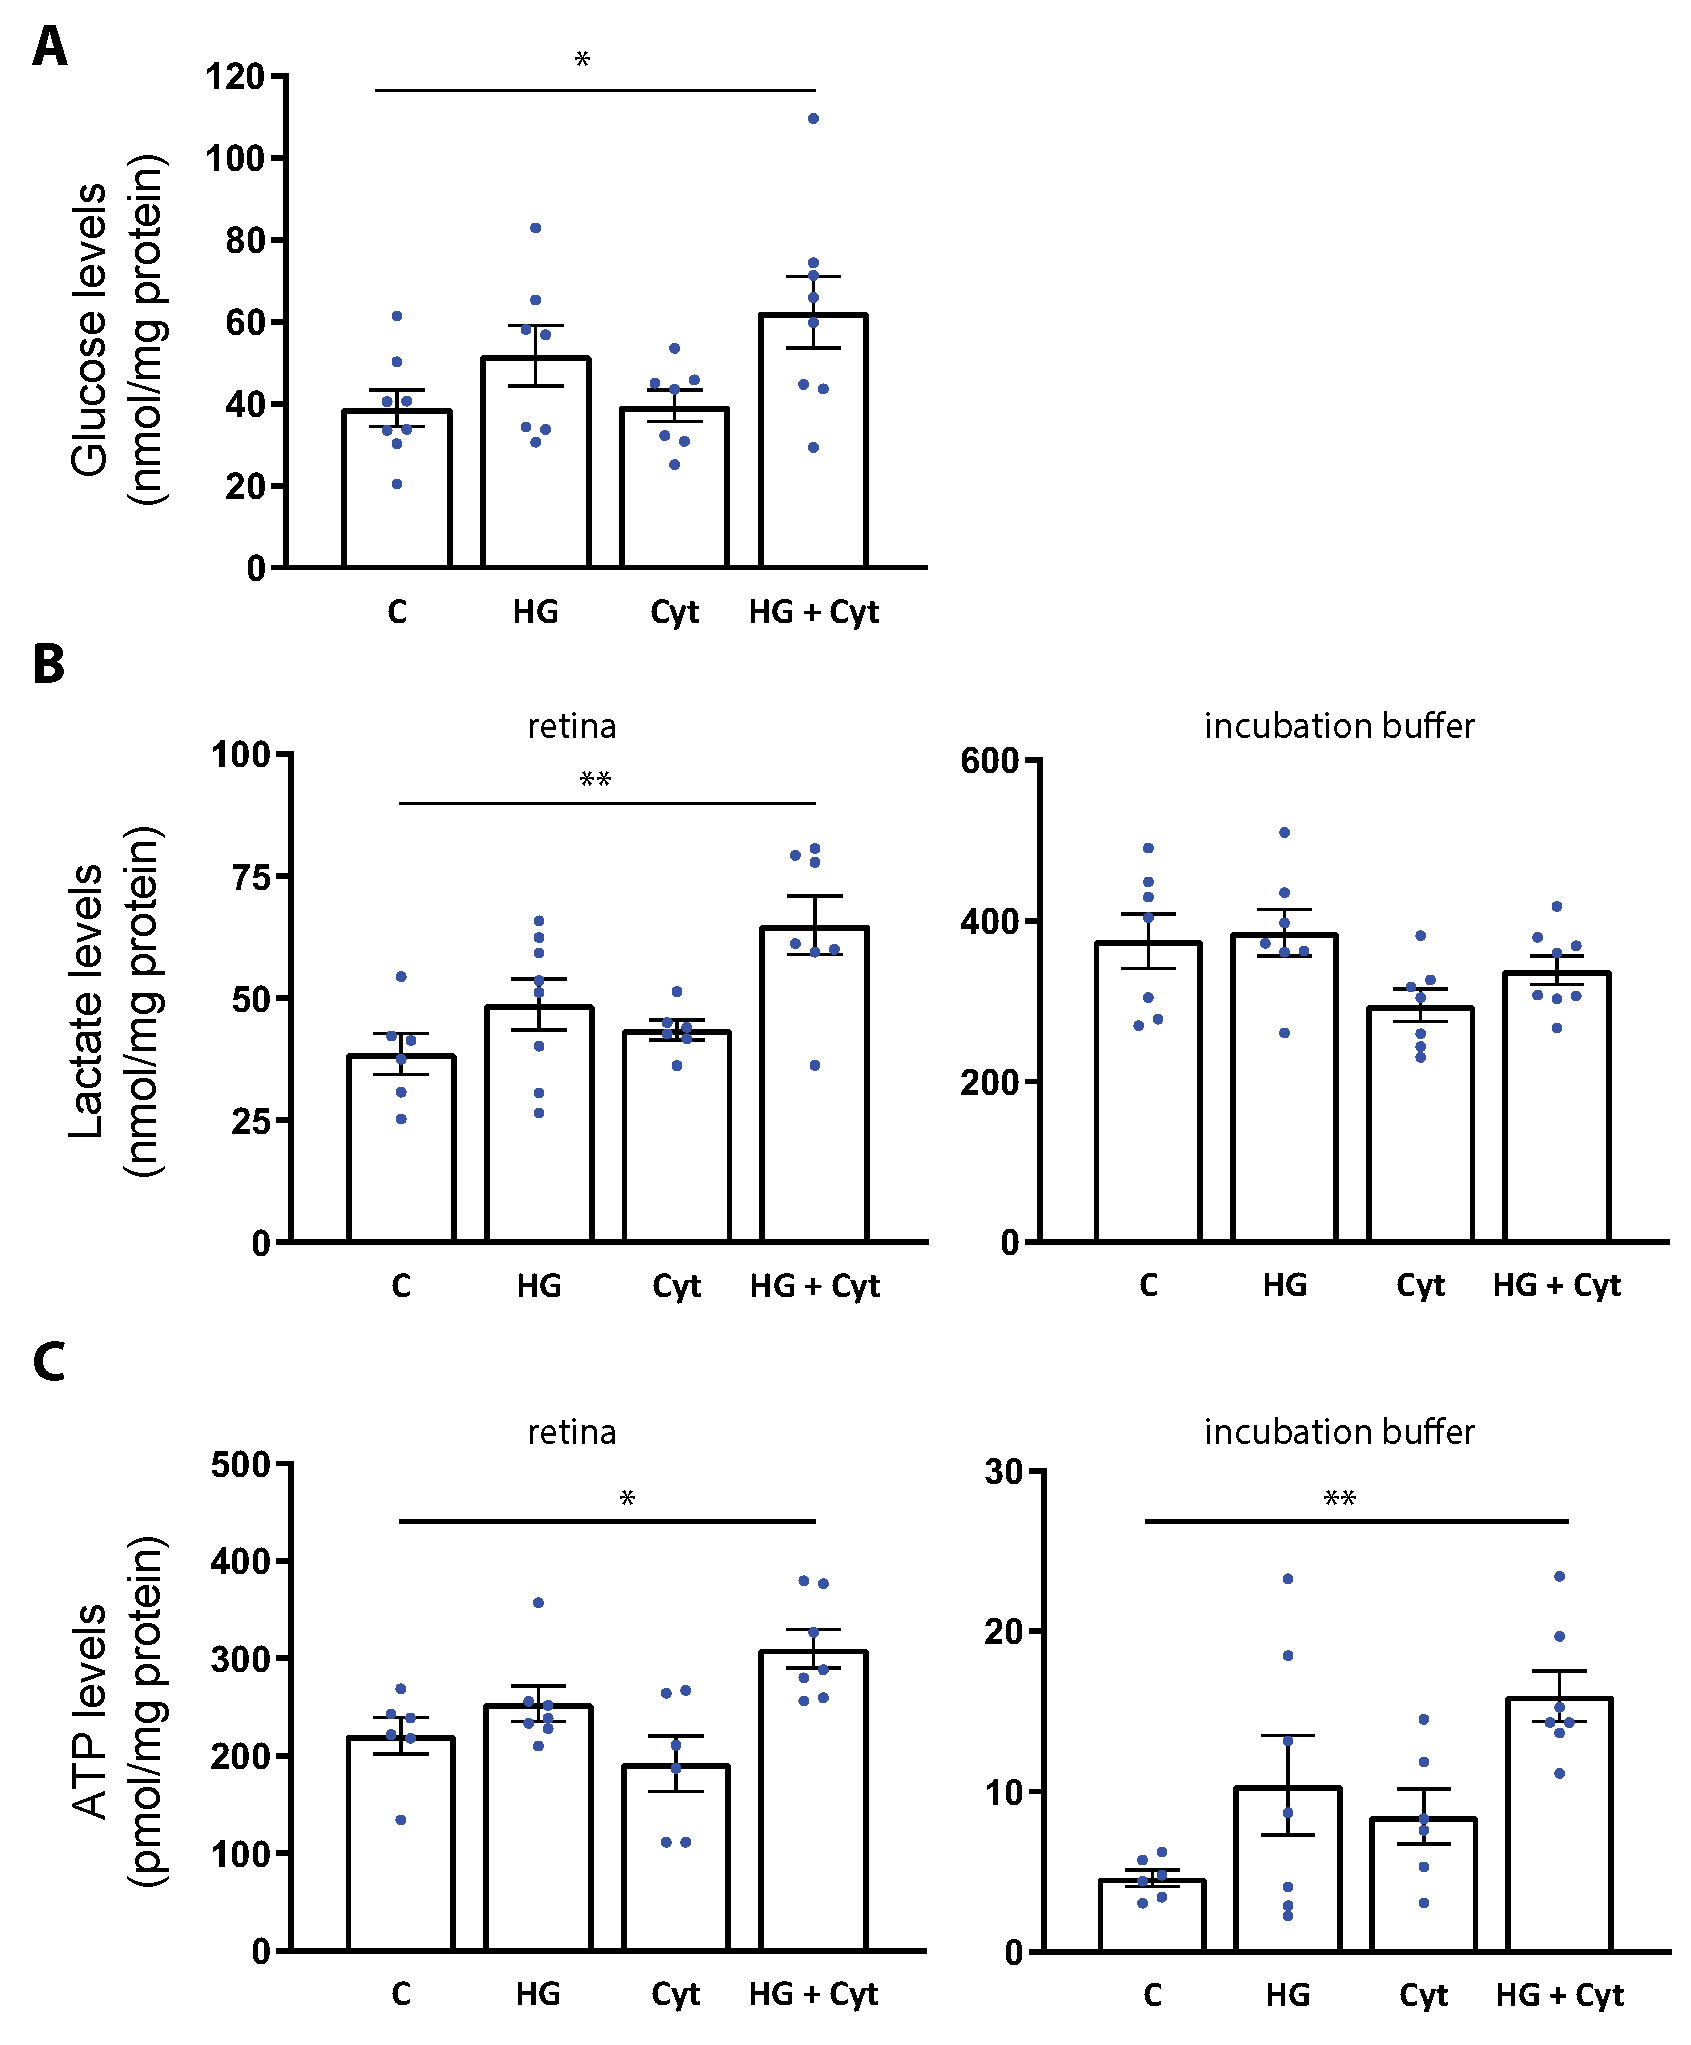
 Figure 2 of
Shivashankar, Mol Vis 2020; 26:277-290.
Figure 2 of
Shivashankar, Mol Vis 2020; 26:277-290.